Distributed Tracing
Awareness continues with another productive week.
The past days was a great dive into the world of observability.

We successfully setup Cruddur to four different observability tools.
Week Two Main Tasks
- Observability
- Open Telemetry with Honeycomb¹
- Rethinking Why
pipis Mhh? - Security in Observability
- Spend Considerations
- Onboard AWS X-RAY²
- Error-Free Code with Rollbar³
- Monitor FlaskApp with CloudWatch⁴
Observability
Before delving into distributed tracing, it is crucial to grasp the broader concept of observability. The last refers to the ability to understand the state of a system by collecting and analyzing data from its different sources.
It became increasingly difficult to track the state of the system by looking at individual components in the Microservices Ecosystem. Observability were invented because we needed a way to understand the state of complex systems.
Why Observability Matters
Observability can help you reduce alert fatigue by providing you with a holistic view of your system. This means that you can be alerted to problems only when they are actually happening, rather than being bombarded with alerts that are not relevant.
The three pillars of observability are,
- Metrics: Metrics are numerical measurements of the state of a system. They can be used to track things like CPU usage, memory usage, and database queries.
- Logs: Logs are records of events that occur in a system. They can be used to track things like errors, exceptions, and unusual activity.
- Traces: Traces are records of the path of a request through a distributed system. They can be used to track things like performance bottlenecks and errors.
Observability can help developers make better decisions and It can be used as a whole for the following main reasons
- Identifying performance bottlenecks: By tracking metrics, you can identify the parts of your system that are using the most resources. This can help you to identify performance bottlenecks and optimize your system for performance.
- Troubleshooting errors: By tracking logs, you can identify the source of errors in your system. This can help you to troubleshoot errors and resolve them quickly.
- Improving reliability: By tracking traces, you can identify the path of requests through your system. This can help you to improve the reliability of your system by identifying potential problems before they cause outages.
Instrumentation and Observability
Instrumentation is the process of adding code to a system to collect data about its behavior. This data can then be used to observe, monitor and troubleshoot the system.
As we will explain below, onboarding to the tools was exactly that, taking this putting that and troubleshoot in between.
The different types of data that can be collected through instrumentation are indeed the three pillars of observability mentioned above.
Here are some of the tools that you can use to instrument your system:
- OpenTelemetry: is an open-source instrumentation framework that facilitates the collection of metrics, logs, and traces from a variety of systems.
- Application Performance Monitoring tools: APM tools are ready-to-use commercial tools and come pre-packaged with features tailored to streamline the key pillars process.
The best tool for you will depend on the specific needs. You will have to get going with OpenTelemtry in the first place to use an APM or create your own.
Monitoring in Observability Ecosystem
Monitoring is a necessary part of observability, but it is not sufficient.
Observability requires a holistic understanding of the system, which can be achieved by collecting data from different sources not just from Metrics.
In other words, monitoring is about knowing what is happening in a system, while observability is about understanding why something is happening.
| Feature | Observability | Monitoring |
|---|---|---|
| Purpose | Understanding the state of a system | Identifying problems |
| Data sources | Metrics, logs, traces | Metrics |
| Goal | Understanding the why | Understanding the what |
| Approach | Holistic | Focused |
| Tools | Distributed tracing, logging, metrics | Monitoring tools |
Observability is a broader concept than monitoring, and it can be used to achieve a wider range of goals. However, monitoring is a necessary part of observability, and it can provide valuable insights into the state of a system.
Distrubuted Tracing
Distributed tracing is a natural extension of observability.
Distributed tracing is a type of trace that records the path of a request through a distributed system. It is a powerful tool that can help you to identify performance errors and other problems. It can also help you to troubleshoot problems and to improve the reliability of the system.
Core components that make it are below.
- Trace: a collection of spans that represent the path of a single request through a distributed system.
- Span: a unit of work within a trace. It represents a specific event or operation that occurred during the processing of a request.
- Context propagation: the process of passing a trace identifier from one service to another as a request is processed. This allows the different services to associate their spans with the same trace.
- Instrumentation libraries: used to instrument applications so that they can generate spans. These libraries typically provide APIs that allow developers to tag spans with metadata, such as the name of the service, the operation, and the start and end time.
- Tracing data collectors: Tracing data collectors are used to collect spans from the different services in a distributed system. These collectors typically store spans in a database or other persistent storage.
- Tracing data visualizers: Tracing data visualizers are used to visualize traces. These tools allow developers to see the path of a request through a distributed system and to analyze the performance and reliability of the system.
Observability on AWS
AWS provides a comprehensive set of services and tools to help you achieve observability for your applications and services.
Some of the key AWS services and tools for observability include:
- Amazon CloudWatch: CloudWatch is a monitoring service that provides you with a central place to collect and store metrics, logs, and traces from your AWS resources.
- Amazon X-Ray: X-Ray is a distributed tracing service that helps you to understand the path of a request through your distributed system.
- AWS Distro for OpenTelemetry: OpenTelemetry is an open-source instrumentation framework that can be used to collect metrics, logs, and traces from a variety of systems.
- AWS Distrokit: Distrokit is a collection of open-source tools that can be used to instrument and monitor your applications.
This week, we will focus on the successful onboarding process of both AWS CloudWatch and X-Ray, allowing us to gain valuable insights from both services. But also Including the two great external products, Rollbar and Honeycomb.
| Tools | Description |
|---|---|
| Honeycomb | A Distributed Tracing and Observability platform to debug complex systems. |
| AWS X-Ray | Tracing service to analyze and debug distributed applications. |
| Cloudwatch | Monitoring and observability service in the AWS Console. |
| Rollbar | Cloud-based log monitoring tool to identify software errors in real-time. |
Spend Considerations
Note: The free tiers for these tools may change over time. Please check the individual tool's website for the most up-to-date information.
| Tool | Free Tier | Paid Tier |
|---|---|---|
| Honeycomb | 20,000,000 events notifications per month | Starts at $0.00025 per event |
| Rollbar | 5,000 free events per month | Starts at $0.02 per event |
| AWS X-Ray | 100,000 traces recorded, 1M traces scanned or retrieved per month | Free with AWS |
| Amazon CloudWatch | 10 Custom Metrics and 10 Alarms | Free with AWS |
Additional Costs Considerations
Honeycomb
Honeycomb provides OpenTelemetry support, activity + team history, query result permalinks, and Honeycomb metrics to help you troubleshoot problems, understand how your application is being used, and track your application's performance.
Rollbar
Rollbar is a powerful observability tool that provides unlimited users and projects, 2FA and encryption at rest, real-time feed and alerts, intelligent error grouping, stack traces and telemetry, deploy and version tracking, people tracking, Rollbar Query Language (RQL), and 30 days data retention.
AWS XRAY
There are additional charge for sampling.
| Feature | Free tier | Pay-as-you-go | Reserved capacity |
|---|---|---|---|
| Traces recorded | 100,000 | $0.00001 per trace | $0.000007 per trace |
| Traces scanned or retrieved | 1,000,000 | $0.00001 per trace | $0.000007 per trace |
| Trace data stored | 1 GB | $0.00003 per GB per month | $0.00002 per GB per month |
Amazon CloudWatch
Amazon CloudWatch is a monitoring and observability service that provides metrics, logs, and events for AWS resources and applications, with a free tier that includes 1,000,000 API requests, 5GB of log data ingestion and 5GB of log data archive, and 3 dashboards with up to 50 metrics each per month.
Open Telemetry with Honeycomb
Allow me to serve as your knowledgeable guide, leading you through a meticulously structured journey of discovery and enhancement.
Let's begin with the first observability tool placed on the table Honeycomb.
OpenUp to OpenTelemetry
Telemetry refers to the process of collecting and transmitting data from remote or inaccessible locations to a central location for analysis, monitoring, or control.
On the other hand, OpenTelemetry is an open source project governed by the CNCF and was originally created by Google and Jaeger, but it has since been adopted by a wide range of organizations, including Microsoft, AWS, and Red Hat.
OpenTelemetry is a set of tools, APIs, and SDKs that allow you to collect telemetry data from your applications. Telemetry data includes things like performance and the three key pillars and can be used to collect telemetry data from a wide variety of languages and frameworks e.g Python for our case.
Honeycomb is a cloud-native observability and monitoring platform that fully supports and leverages the OpenTelemetry project.
Setup
Head over honeycomb.io, sign up and retrieve the api key.
- Create an environment.
- Export your environment API key and service name to Gitpod.
export HONEYCOMB_API_KEY="<api-key>"
export HONEYCOMB_SERVICE_NAME="<service-name>"- Make the variables locked in your environnement
gp env HONEYCOMB_API_KEY="<api-key>"
gp env HONEYCOMB_SERVICE_NAME="<service-name>"- Set the environment variables in
docker-compose.ymlunder backend.
OTEL_SERVICE_NAME: "backend-flask"
OTEL_EXPORTER_OTLP_ENDPOINT: "https://api.honeycomb.io"
OTEL_EXPORTER_OTLP_HEADERS: "x-honeycomb-team=${HONEYCOMB_API_KEY}"
Instrumentation
- Add these packages to
requirements.txtand runpip3 install -r requirements.txt.
opentelemetry-api
opentelemetry-sdk
opentelemetry-exporter-otlp-proto-http
opentelemetry-instrumentation-flask
opentelemetry-instrumentation-requests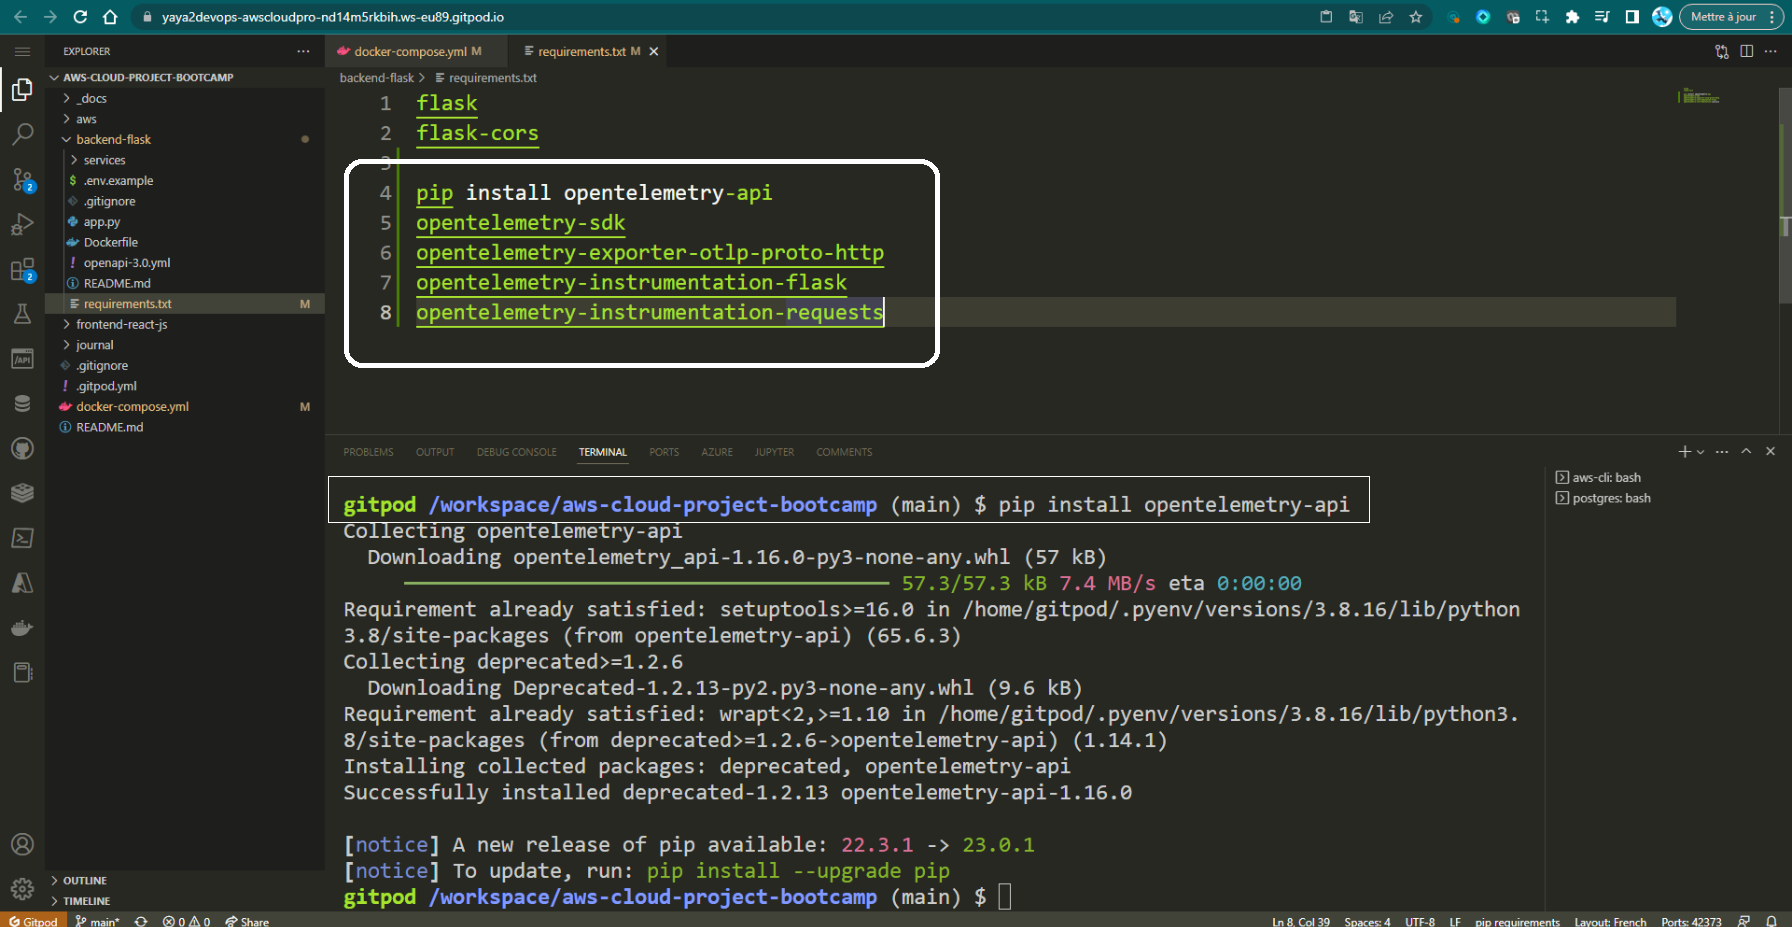
- Add these import statements in
app.py.
from opentelemetry import trace
from opentelemetry.instrumentation.flask import FlaskInstrumentor
from opentelemetry.instrumentation.requests import RequestsInstrumentor
from opentelemetry.exporter.otlp.proto.http.trace_exporter import OTLPSpanExporter
from opentelemetry.sdk.trace import TracerProvider
from opentelemetry.sdk.trace.export import BatchSpanProcessor- Set up tracing and an exporter that can send data to Honeycomb just below all the import statements.
OTLPSpanExporter() reads the Honeycomb environment variables.
provider = TracerProvider()
processor = BatchSpanProcessor(OTLPSpanExporter())
provider.add_span_processor(processor)
trace.set_tracer_provider(provider)
tracer = trace.get_tracer(__name__)- Initialize automatic instrumentation with Flask
Add this below app = Flask(__name__).
FlaskInstrumentor().instrument_app(app)
RequestsInstrumentor().instrument()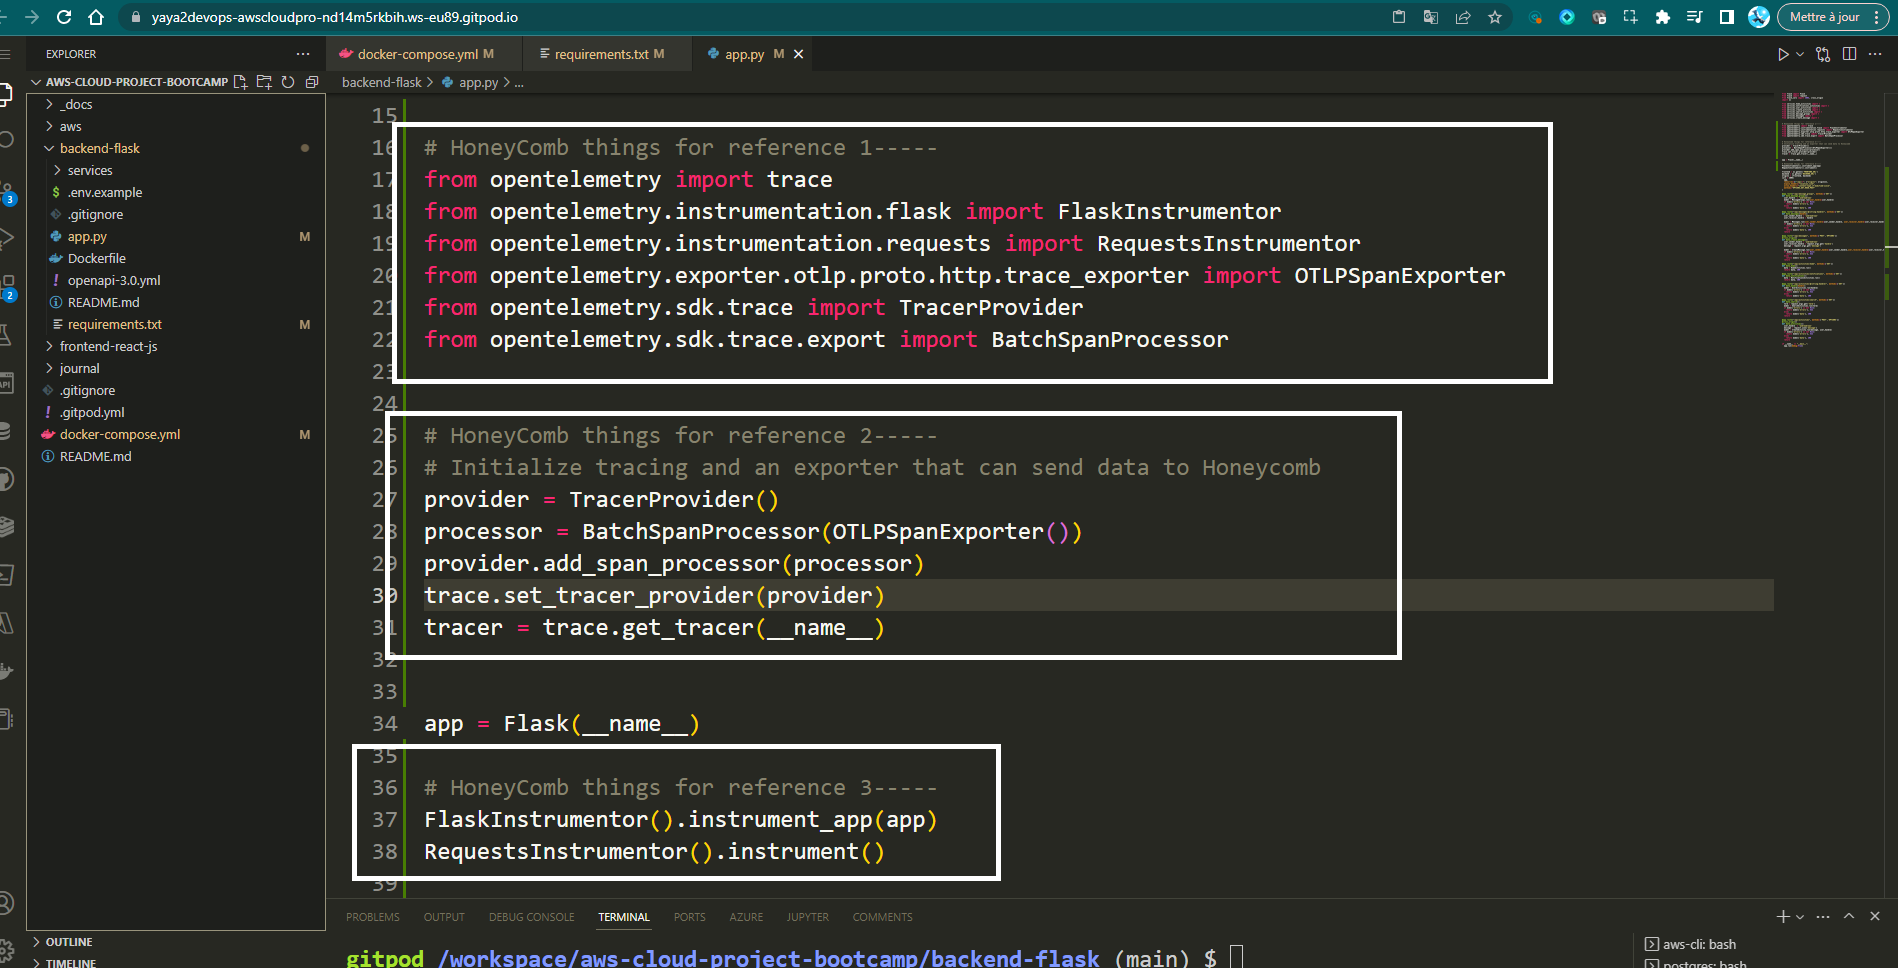
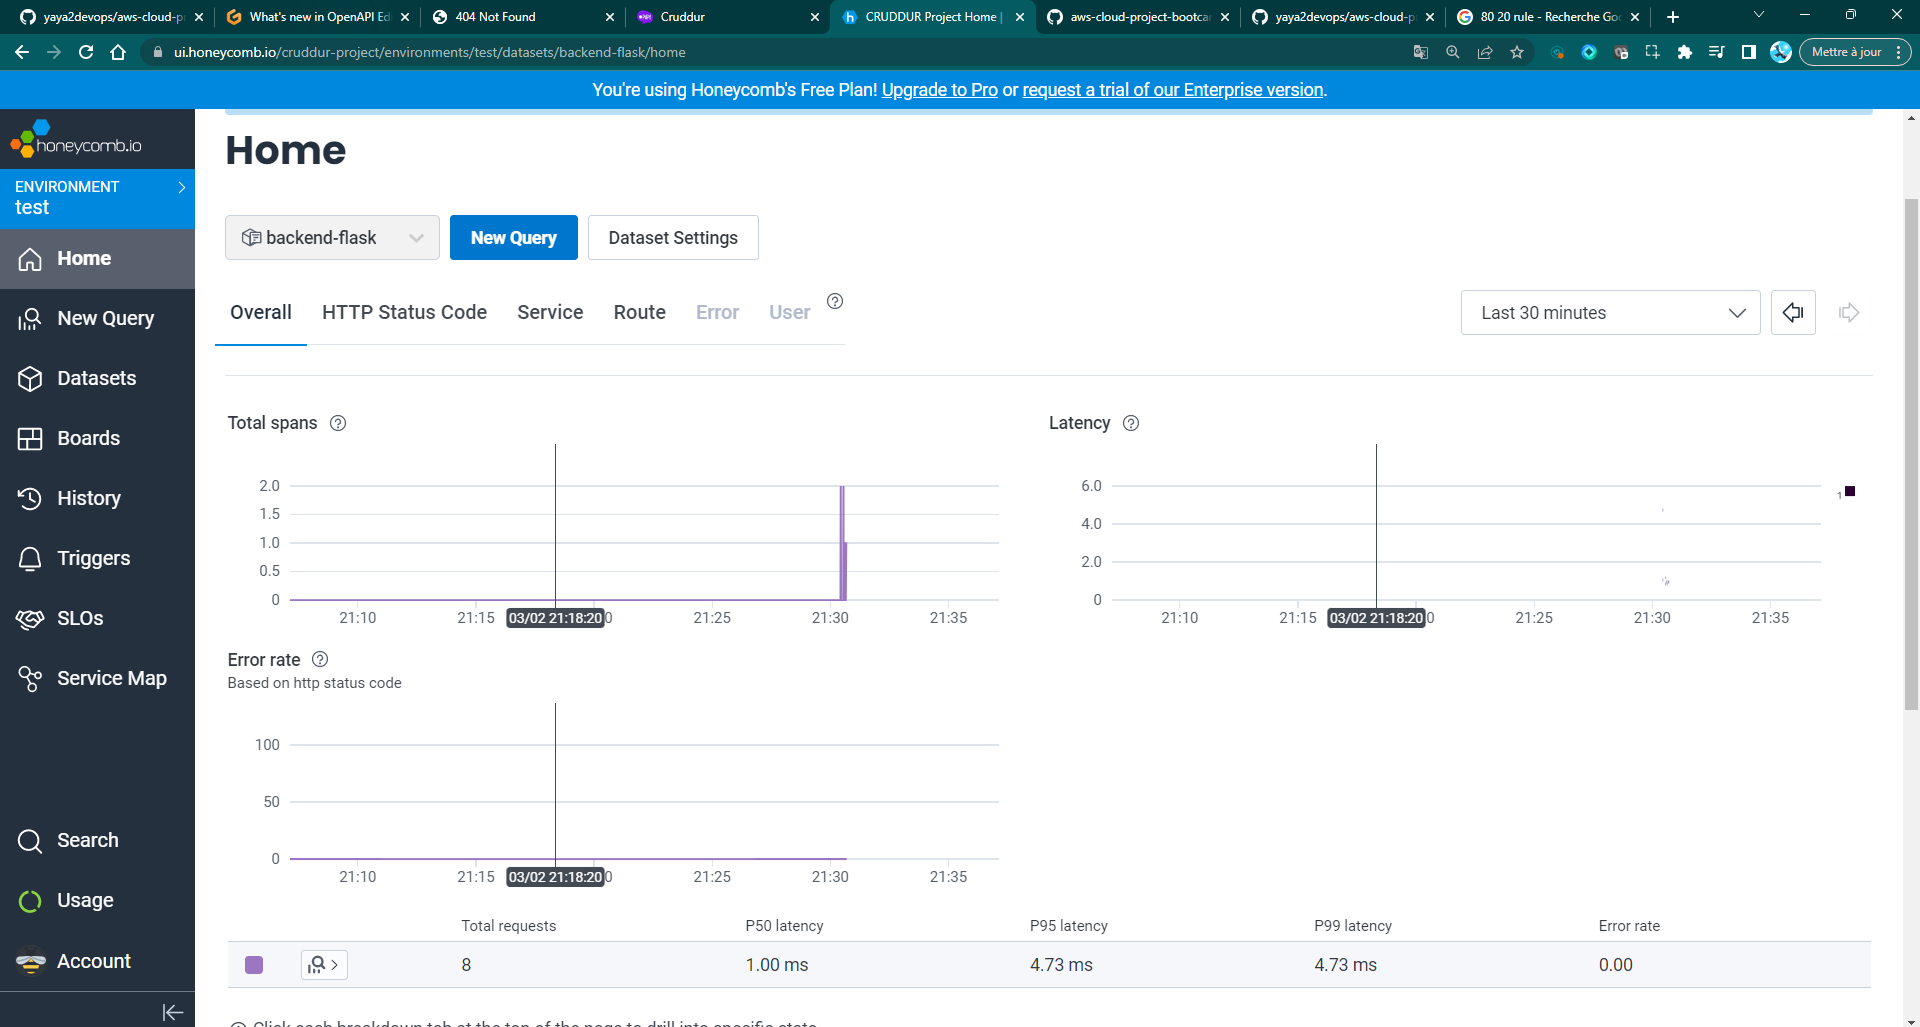
After a successful setup, launch the application and head over honeycomb.
Your Application starts providing data to the platform.
Spans and Traces in Open Telemetry
-
A span is a unit of work that is executed within a trace. Spans are used to track the execution of your application, and they can be used to collect performance data, identify bottlenecks, and troubleshoot problems.
-
A trace is a collection of spans. Traces are used to track the flow of execution through your application. They can be used to identify the root cause of problems, and they can be used to visualize the performance of your application.
When traces are sent to Honeycomb, the name of the Tracer is turned into the library.name field, which can be used to show all spans created from a particular tracer.
Adding spans and attributes to tracers
To create a span, you need to get a Tracer. A Tracer is a factory for creating spans. When you create a Tracer, you need to give it a name as a string. This string is the only required parameter.
Once you have set up tracing, you can add spans and attributes to tracers. A span is a unit of work that is executed within a trace. An attribute is a piece of data that can be attached to a span.
To add a span and attribute to a tracer, you can refer to the following.
- create a trace and include a name
from opentelemetry import trace
tracer = trace.get_tracer("home.name.tracer")- Inside the class, Create a span and name it. This is used to initiate a new span.
class HomeActivities:
  def run():
with tracer.start_as_current_span("home-activities-mock-data"):- Allow access to the current active span:
span = trace.get_current_span()- Implement additional tracing and metadata capabilities
      now = datetime.now(timezone.utc).astimezone()
      span.set_attribute("app.now", now.isoformat())
      span.set_attribute("app.result_length", len(results))
In the grand scheme of this crafted code, the implementation will take this form.
from opentelemetry import trace
tracer = trace.get_tracer("home.activities")

class HomeActivities:
  def run():
    with tracer.start_as_current_span("home-activities-mock-data"):
      span = trace.get_current_span()
      now = datetime.now(timezone.utc).astimezone()
      span.set_attribute("app.now", now.isoformat())
      span.set_attribute("app.result_length", len(results))
In this code, we are creating a span named home-activities-mock-data and setting an attribute named app.now. The value of the attribute is the current time, as returned by the app.now() function.
Once we have added a span and attribute to a tracer, we can view them on the Honeycomb website.
To do this, you need to launch the app and browse the backend endpoint of /api/activities/home.
The traces will be displayed.
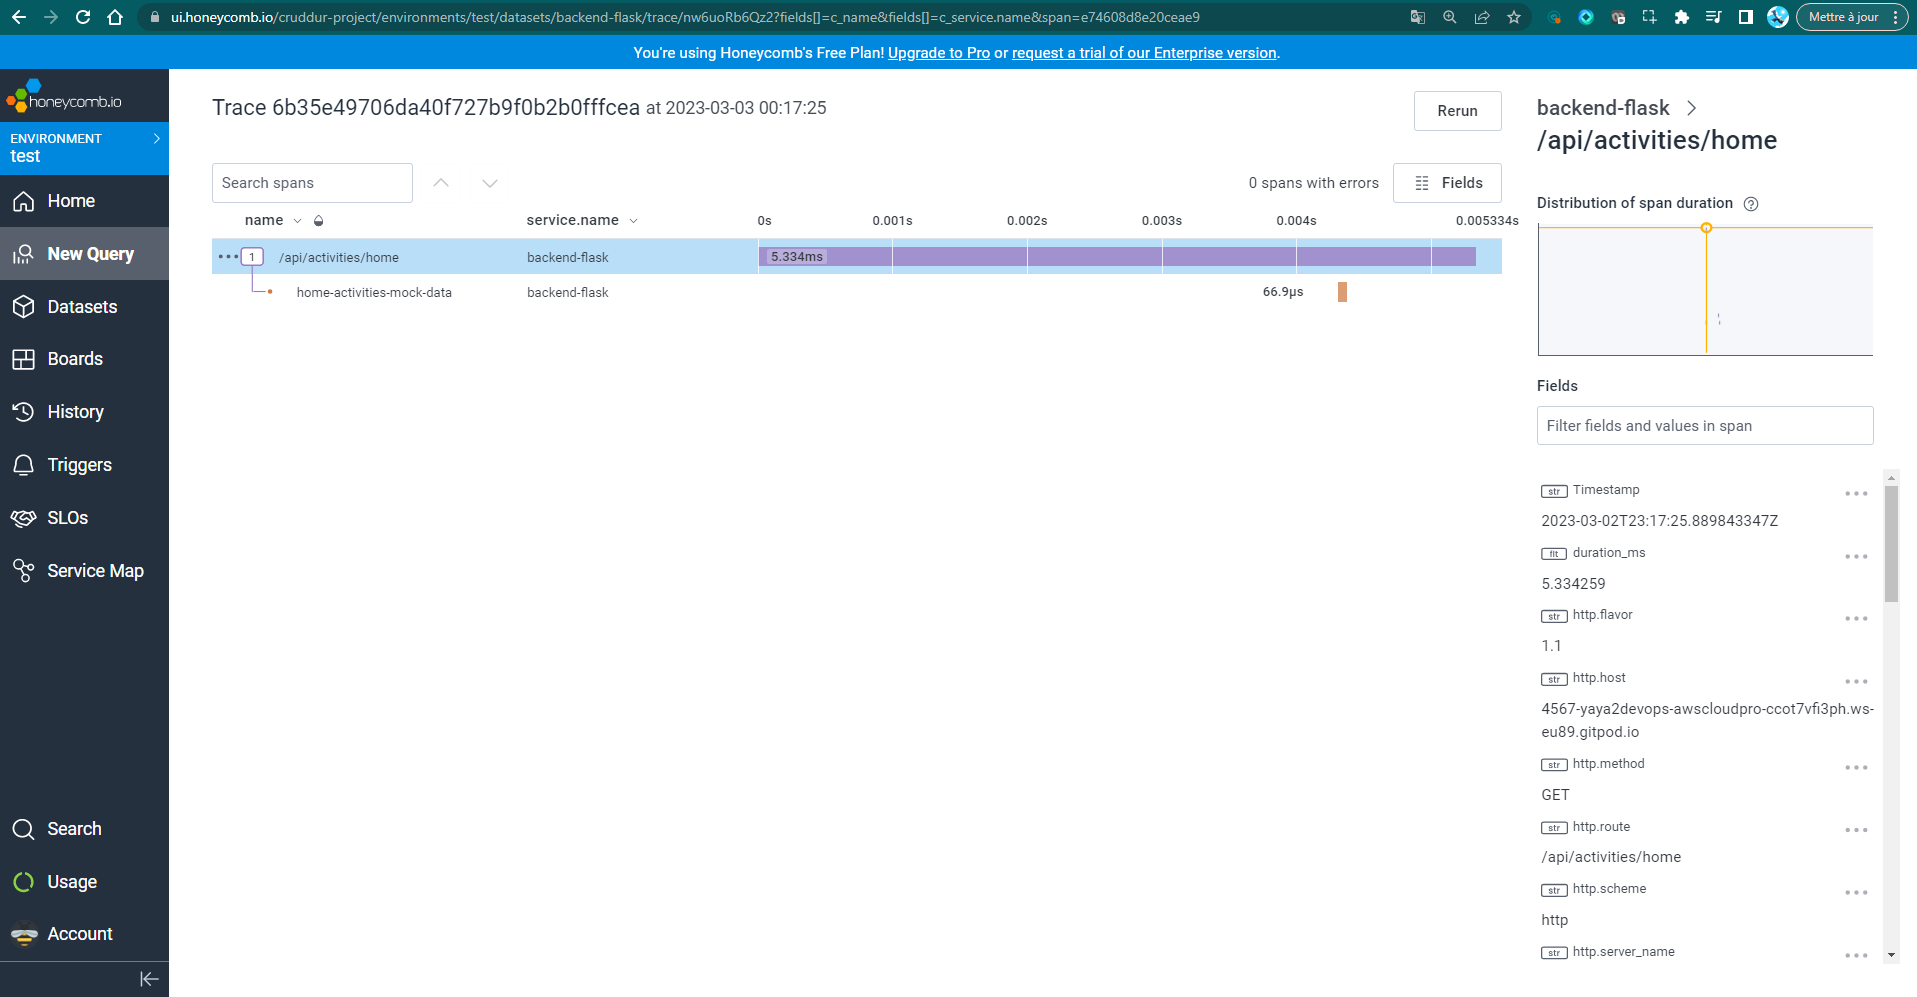
To retrieve specific data such as "app.now" and "app.result_length," all you need to do is select the desired span and use the search functionality by typing "app." on the current page.
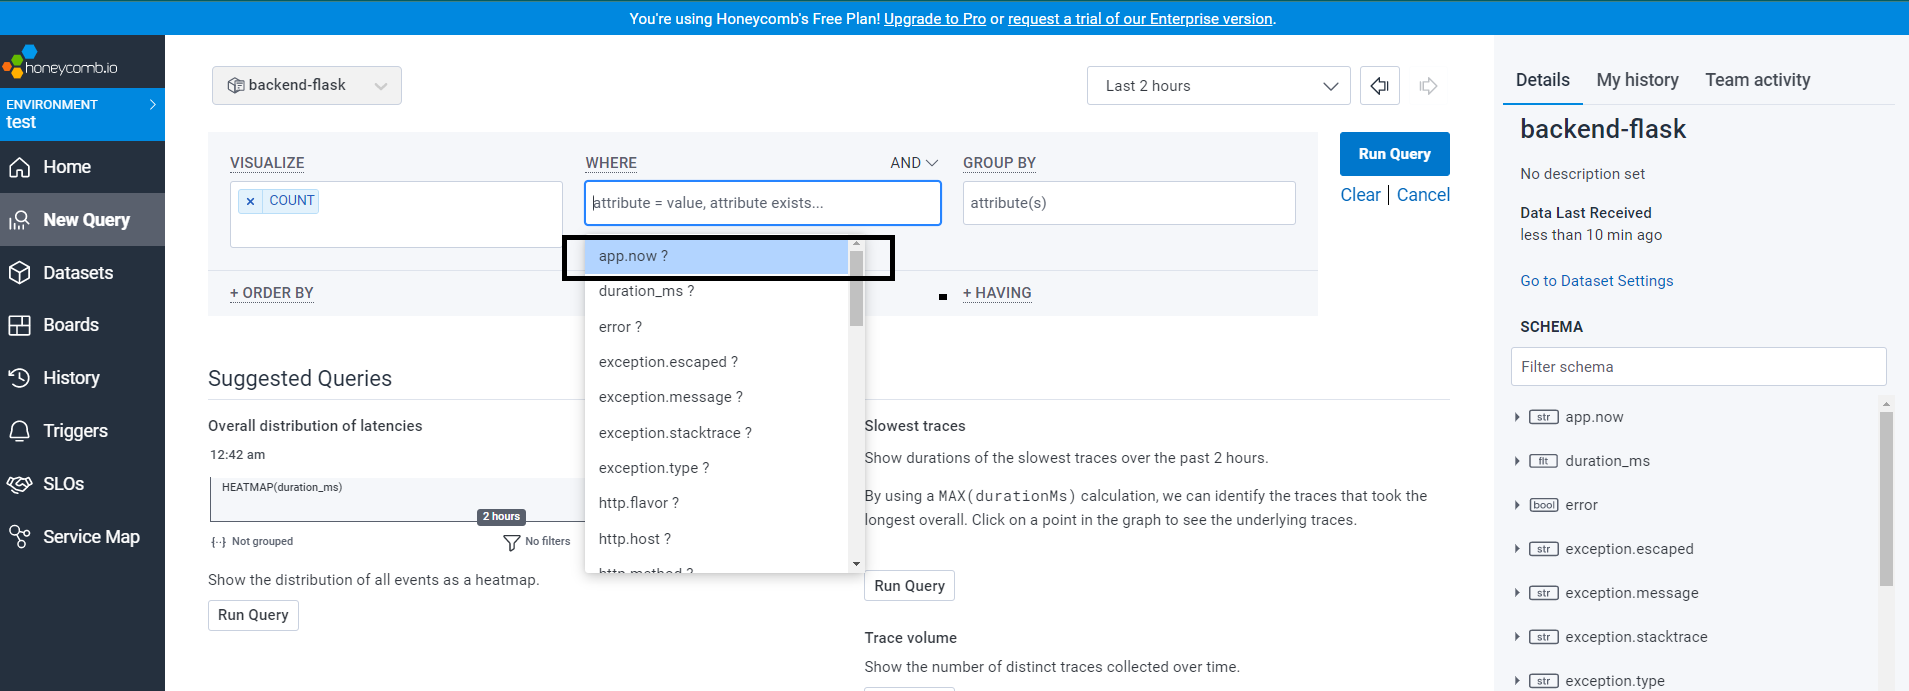
Feel free to check the query from here
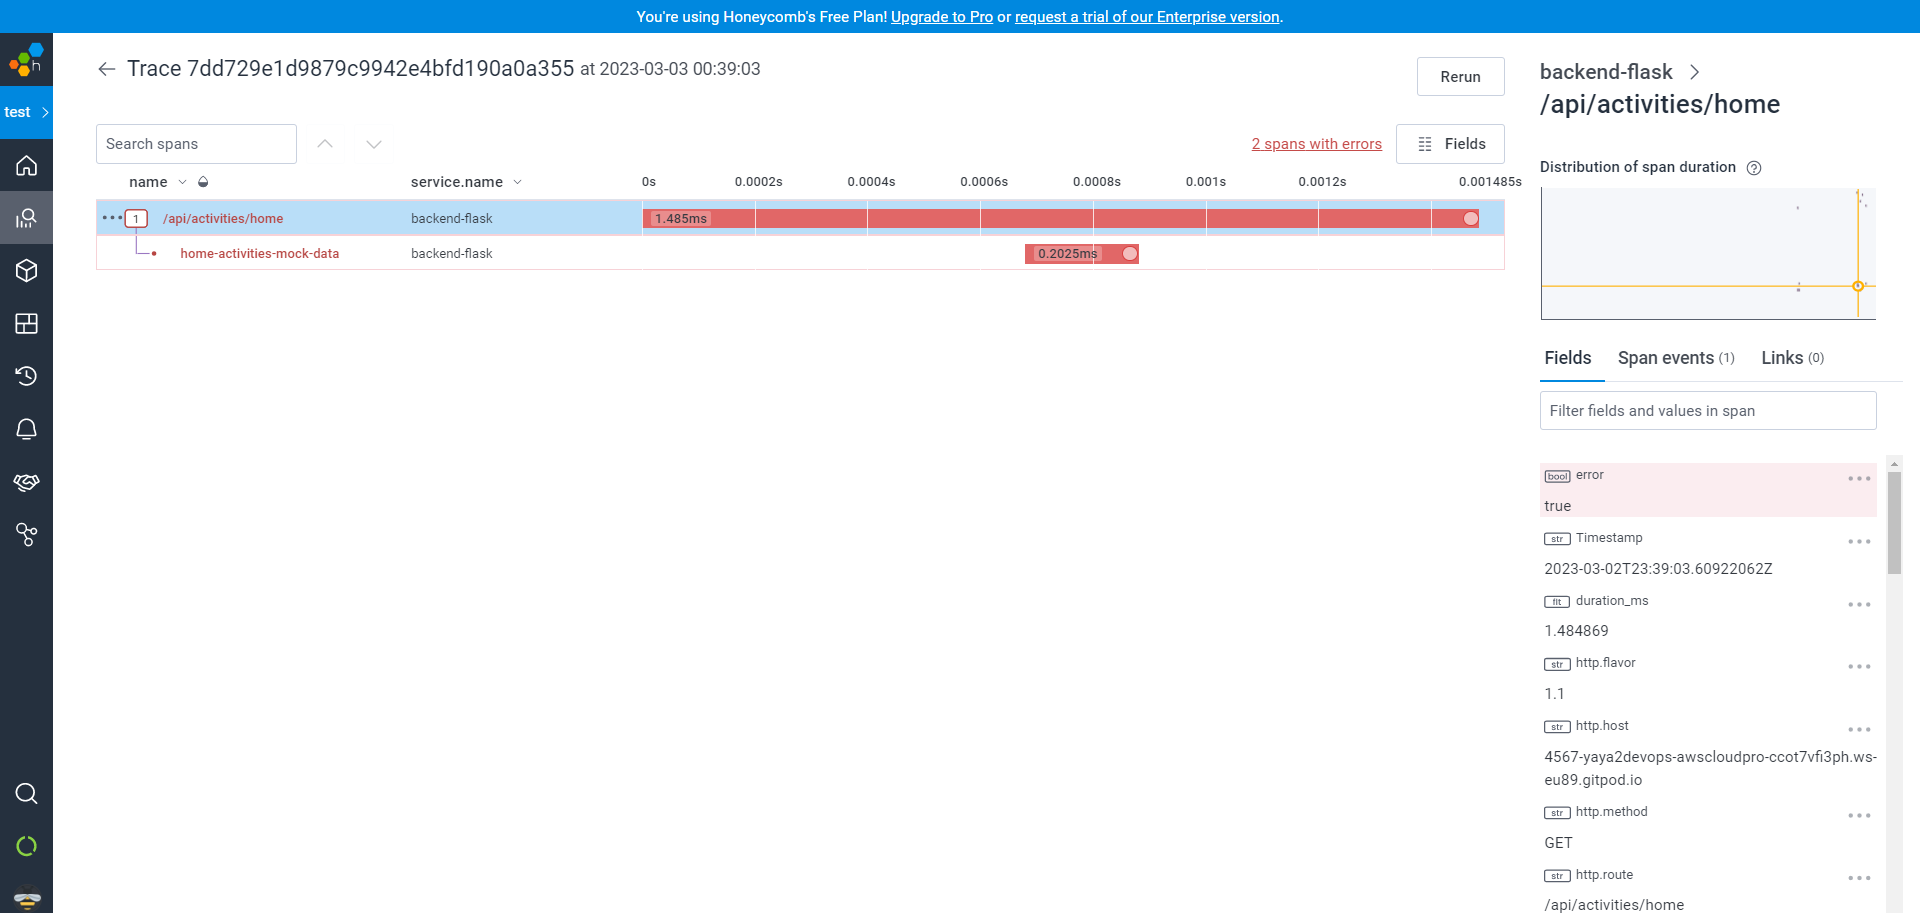
You can also test the real-time functionality of the app by intentionally introducing an error.
For example, this error occurred because I called the endpoint after running Docker Compose with a Python syntax error due to missing indentation:
Honeycomb for Better Observability
Having more instrumentation means to a better understanding of your errors and how to shoot solving them.
- Import the
tracerandtraceobjects from theopentelemetrylibrary.
from opentelemetry import trace
tracer = trace.get_tracer(__name__)- Create a new span with the
tracer.start_as_current_span()method.
span = tracer.start_as_current_span("home_activity")File: home_activity.py
- Set the attributes of the span, such as the
app.result_lengthanduser.id attributes.
span.set_attribute("app.result_length", len(results))
span.set_attribute("user.id", user.get("userID"))- Create nested spans with the
tracer.start_as_current_span()method.
with tracer.start_as_current_span("flaskfunc") as inner_span:
    inner_span.set_attribute("inner", True)
    span.set_attribute("user.id", user.get("user"))
    with tracer.start_as_current_span("flaskfuncfunc") as sub_inner_span:
span.set_attribute("user.id", user.get("userID"))- Set the attributes of the nested spans.
inner_span.set_attribute("inner", True)
span.set_attribute("user.id", user.get("user"))- Add events to the spans.
current_span = trace.get_current_span()
current_span.add_event("Event is Working!")
Additionally, You can aim to intrument the following use cases.
- Measure Request Duration: Track the time taken for each API request to identify slow endpoints and performance bottlenecks.
- Track Errors: Monitor and analyze error occurrences to quickly detect and resolve issues.
- Monitor User Behavior: Instrument user actions like login/logout to understand how users interact with your app.
- Analyze Database Queries: Monitor database query execution time and frequency to optimize performance.
- Track API Endpoint Usage: Identify frequently accessed endpoints to understand critical app areas.
- Monitor Resource Utilization: Measure CPU, memory, and system resource usage to identify resource-intensive parts.
- Analyze External Service Calls: Monitor response times of interactions with external services for potential issues.
- Capture Custom Business Events: Instrument app-specific events to gain insights into user behavior and conversions.
- Track Feature Usage: Monitor feature flags or A/B tests to understand their impact on user engagement.
- Monitor Geolocation Data: Track location-related events for insights based on geographical locations.
Learn more.
The key is to choose instrumentation that aligns with your specific application's goals and requirements.
Heatmap in Honeycomb
Heatmap is a graphical representation of data that provides a visual overview of the distribution and density of events over a specified period. It displays aggregated metrics related to service performance, request latency, error rates, or other custom attributes.
- Open the menu on Left-Hand Side and select "New Query" to start building a new query.
- In the query editor, set the visualization options to
HEATMAP(duration_ms)and"P90(duration_ms)for the desired analysis. - Once the options are configured, run the query to generate the heatmap visualization.
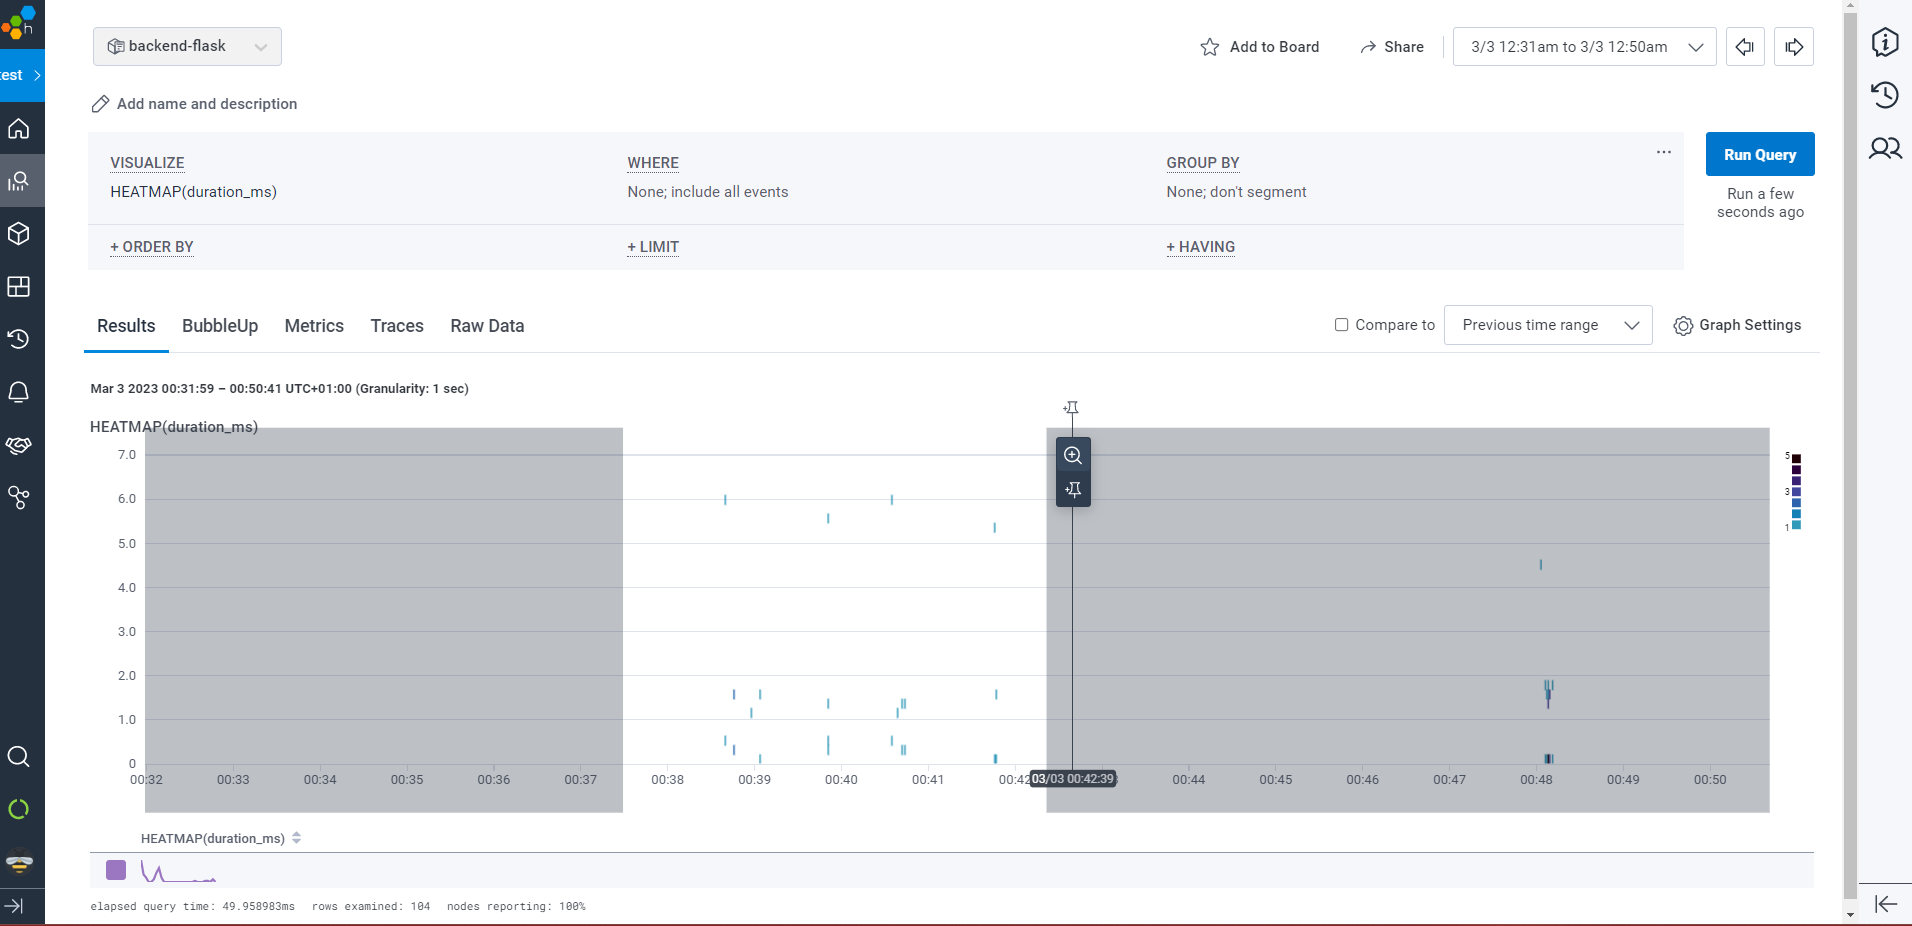
You have the ability to zoom in and out on the heatmap, allowing you to see the details more clearly.
Honeycomb Who Am I?
The Honeycomb Who Am I? project is designed to provide insights into what system is this. Lol.
When you have the tools spreads out before you, it's easy to lose track of what was this for and which is assigned to what task, so the projet comes along.
- Accessing the Tool: Navigate to the URL provided here (opens in a new tab) to access the "Honeycomb Who Am I?" tool interface.
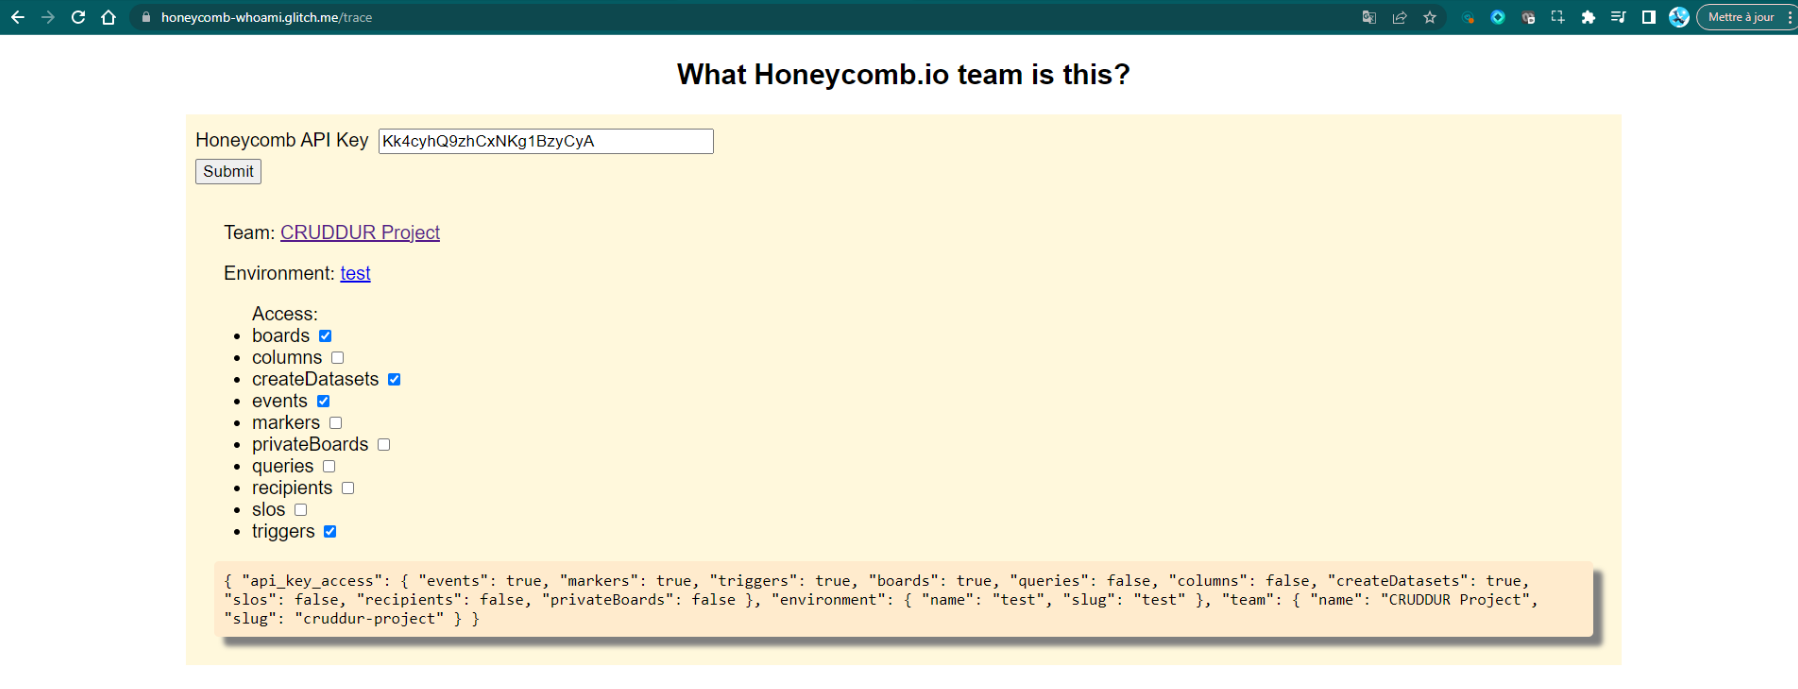
- API Key Input:
You will be prompted to provide your Honeycomb API key. Copy and paste the provided API key (
Kk4cyhR9ksCxNbrg6zyCyA) into the designated field. - Submit and Authenticate: Click on the "Submit" button after entering the API key. This will authenticate your access to the Honeycomb platform.
- Understanding the Context: The tool will provide information about the team, environment, and access privileges associated with the provided API key. For example:
- Team: CRUDDUR Project
- Environment: test
- Access: List of available Honeycomb features and access levels.
- Performing Troubleshooting: Once authenticated, you can use the tool to troubleshoot specific issues related to your application or system. Here are the steps to follow:
- a. Define the Problem: Clearly define the issue you want to investigate. For example, you might want to understand why certain API requests are slow or why errors are occurring in your application.
- b. Instrumentation: Ensure that your application is correctly instrumented to send traces and telemetry data to Honeycomb. If not already done, refer to Honeycomb's documentation to set up the necessary configurations.
- c. Filter Data: Use the tool's filtering options to narrow down the data you want to analyze. You can focus on specific time frames, endpoints, services, or other relevant criteria.
- d. Explore Traces: Dive into individual traces to understand the flow of requests through your system. Look for patterns, anomalies, or any indications of errors.
- e. Visualize Performance Metrics: Utilize the tool's built-in visualizations to analyze performance metrics such as response times, latency, error rates, and more. This can help you identify areas that require attention.
- f. Collaborate and Share: If you are working in a team, share the tool's results and insights with your colleagues to facilitate collaboration and problem-solving.
- g. Iterative Troubleshooting: Address the issues you find through the tool's analysis, and repeat the process iteratively to refine your investigation until you identify and resolve the root cause of the problem.
The tool serves as a powerful resource to gain deeper insights into your system's behavior and performance.
With its comprehensive tracing and troubleshooting capabilities, it paves the way for data-driven decision-making and proactive tracing problem-solving.
The Distributed Tracing System X-RAY
AWS X-Ray is a fully-managed service that helps you understand how your applications work.

X-RAY does this by collecting data about requests as they flow through your application, and then visualizing that data in a way that makes it easy to understand.
Here is a cute diagram that shows how the X-Ray daemon works
Application
   |
   |
   X-Ray Daemon
   |
   |
   X-Ray Service
   |
   |
Customers- The application sends requests to the X-Ray daemon.
- The X-Ray daemon collects data about the requests and sends it to the X-Ray service.
- The X-Ray service stores the data and makes it available to you.
X-Ray can help you
- Identify performance bottlenecks
- Track down errors
- Understand your application's architecture
The X-Ray daemon is a required component of X-Ray, and it must be running on your servers in order for X-Ray to function.
Installing the AWS X-Ray SDK
To use X-Ray, you need to install the AWS X-Ray SDK for your programming language. The SDK will help you collect data about your requests and send it to the X-Ray service.
For Python, you can install the AWS X-Ray SDK by running the following command:
pip install aws-xray-sdkAdd aws-xray-sdk to /backend-flask/requirements.txt
aws-xray-sdkInstrumenting your application
Once you have installed the SDK, you need to instrument your application to collect data about your requests. This involves adding code to your application that will send data to the X-Ray daemon.
- Instrument AWS X-Ray in
/backend-flask/app.py
Precede the main Flask function in app.py by including this code.
from aws_xray_sdk.core import xray_recorder
from aws_xray_sdk.ext.flask.middleware import XRayMiddleware
Insert the following lines directly after initializing the main Flask function with - app = Flask(__name__)
xray_url = os.getenv("AWS_XRAY_URL")
xray_recorder.configure(service='backend-flask', dynamic_naming=xray_url)
XRayMiddleware(app, xray_recorder)
Running the X-Ray daemon
As mentioned earlier, you need to run the X-Ray daemon in order for X-Ray to function.
To run the X-Ray daemon, you can use the following command
- "xray -o -b xray-daemon:2000"Include the following environment variables under the backend service configuration in docker-compose.yml.
AWS_XRAY_URL: "*4567-${GITPOD_WORKSPACE_ID}.${GITPOD_WORKSPACE_CLUSTER_HOST}*"
AWS_XRAY_DAEMON_ADDRESS: "xray-daemon:2000"
X-RAY Daemon as Service
To streamline our processes and reduce repetitive tasks, we can incorporate this into our setup.
Integrate the Daemon Service into Docker Compose by adding the below.
xray-daemon:
    image: "amazon/aws-xray-daemon"
    environment:
      AWS_ACCESS_KEY_ID: "${AWS_ACCESS_KEY_ID}"
      AWS_SECRET_ACCESS_KEY: "${AWS_SECRET_ACCESS_KEY}"
      AWS_REGION: "ca-central-1"
    command:
      - "xray -o -b xray-daemon:2000"
    ports:
      - 2000:2000/udp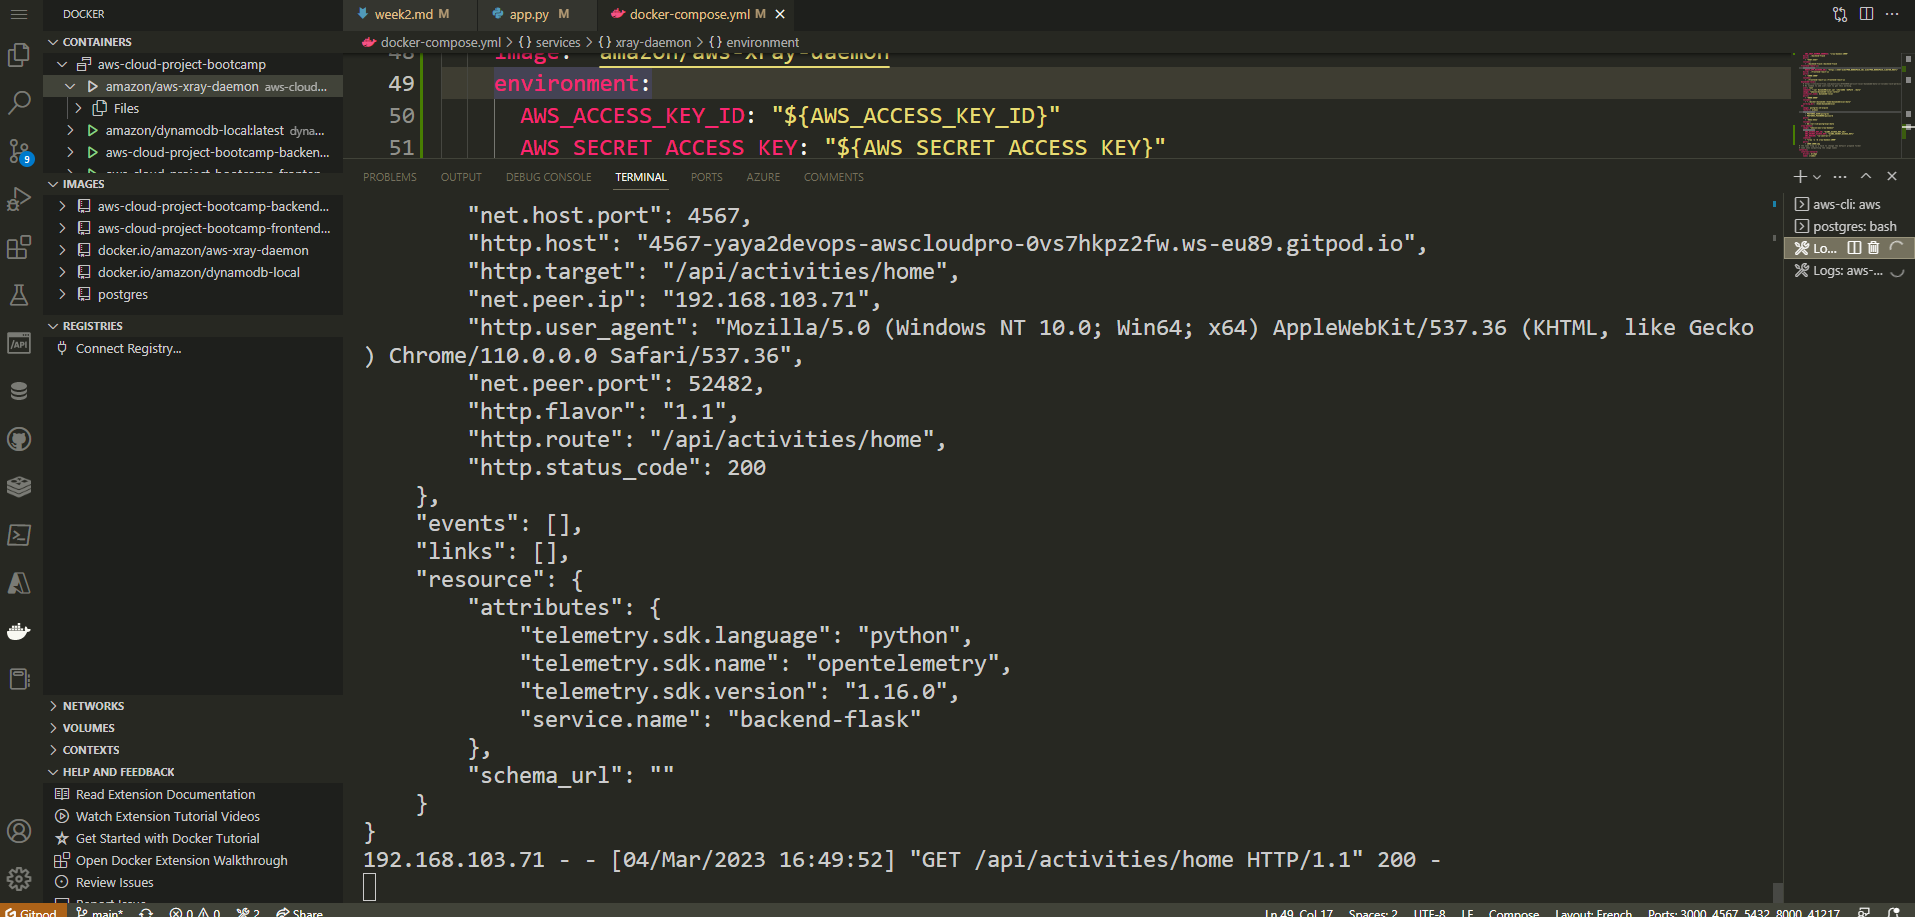
The configuration file defines our service xray-daemon.
image: "amazon/aws-xray-daemon": This line specifies the Docker image to be used for thexray-daemonservice, which is hosted on Amazon ECR (Elastic Container Registry).environment: This section allows setting environment variables for the service. In this case, it includes theAWS_ACCESS_KEY_ID,AWS_SECRET_ACCESS_KEY, andAWS_REGIONvariables. The values for these variables are provided using environment variable syntax, e.g.,${AWS_ACCESS_KEY_ID}will be replaced with the actual access key ID during container runtime.command: Thecommandsection specifies the command to run within the container. In this case, it executes thexraycommand with the parameters-o -b xray-daemon:2000.ports: This section maps the port2000/udpfrom the container to the host's port2000. This enables communication via UDP protocol between the container and the host.
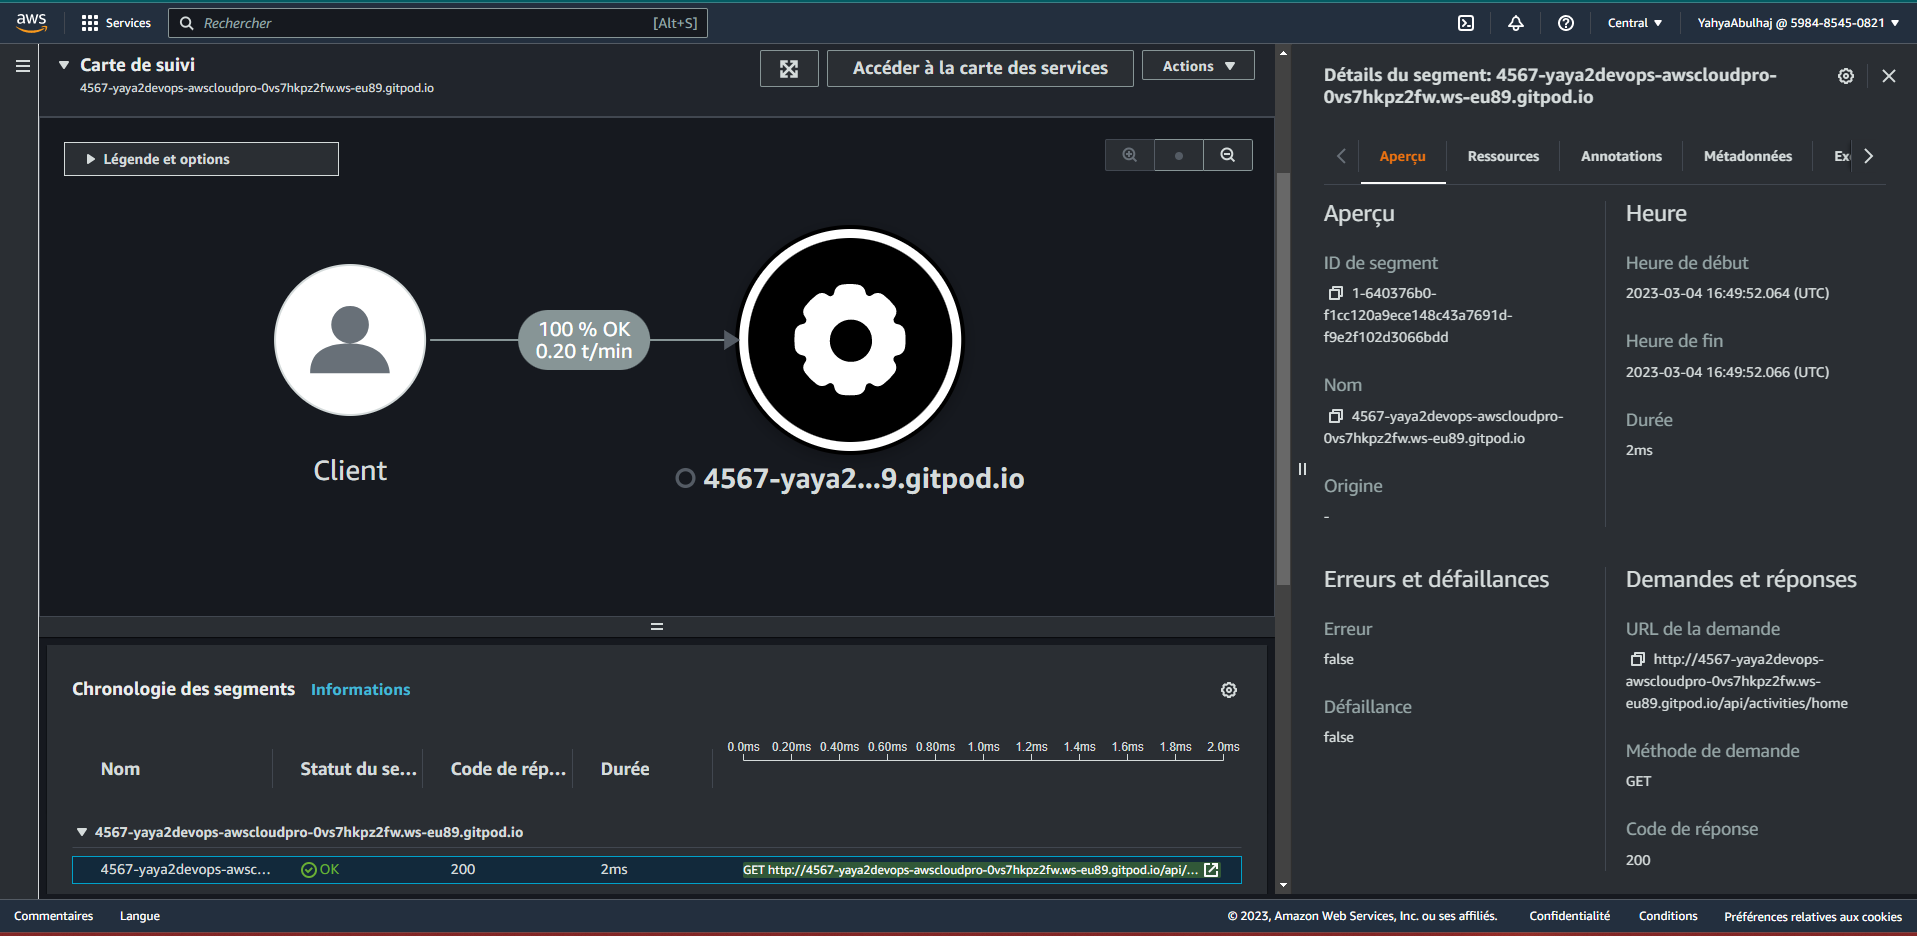
Navigate to X-Ray to observe the data propagated from the platform.

You also have the capability to delve deeper into a specific segment, enabling you to observe and analyze its details comprehensively.
Traces as Groups in X-Ray
An X-Ray group is a collection of traces, and you can use groups to organize your traces.
- It can help you make your traces easier to find.
- It can help you identify errors in your application.
- It can help you track the performance of different parts of your application.
If you do not create a group, all of your traces will be stored in a single group called default. This can be helpful if you only have a few traces, but it can be difficult to find traces if you have a lot of them.
- Create a new X-Ray Group named Cruddur using the following command
aws xray create-group \
   --group-name "Cruddur" \
--filter-expression "service(\"backend-flask\")"- Returning
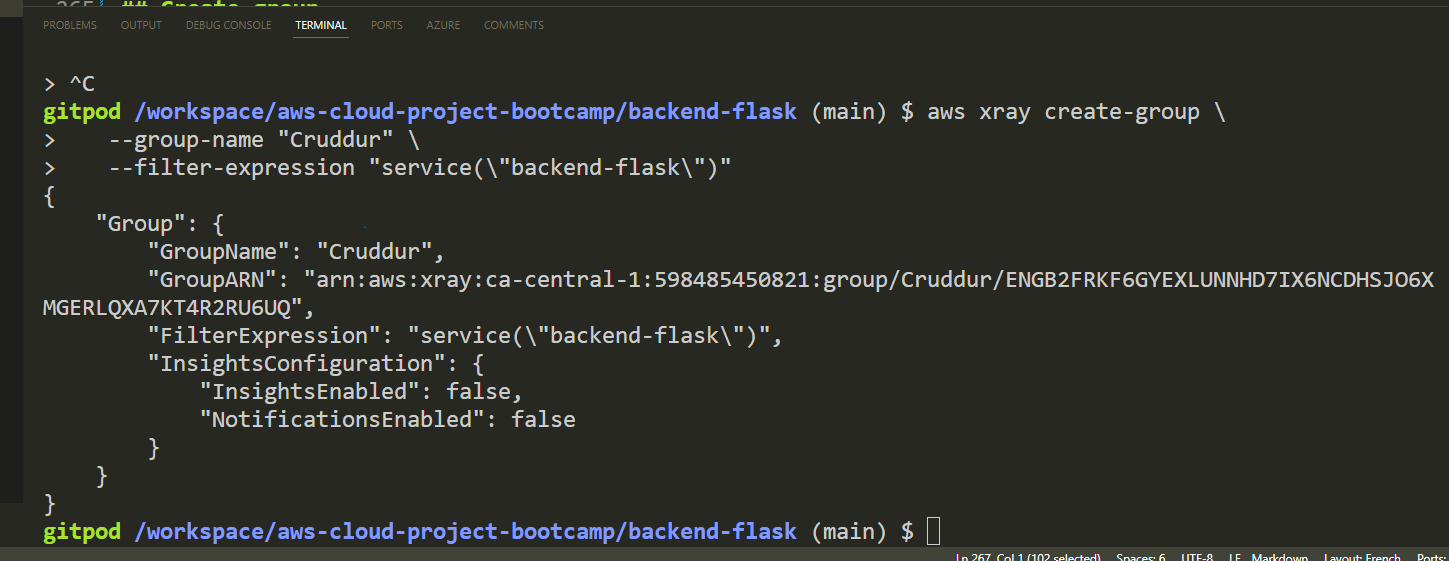
The group will be used to store traces for backend-flask application. The filter expression ensures that only traces for the backend-flask application will be stored in the group.
Here are some additional instructions for creating an X-Ray group
- You must have the AWS CLI installed It includes the X Rray.
- You must be authenticated to the AWS CLI before you can run this command.
- You must have the AWS X-Ray SDK installed in your application.
- Go to the AWS X-Ray console and click the "Groups" section in the left pane under "Configuration" to ensure that the group has been created.
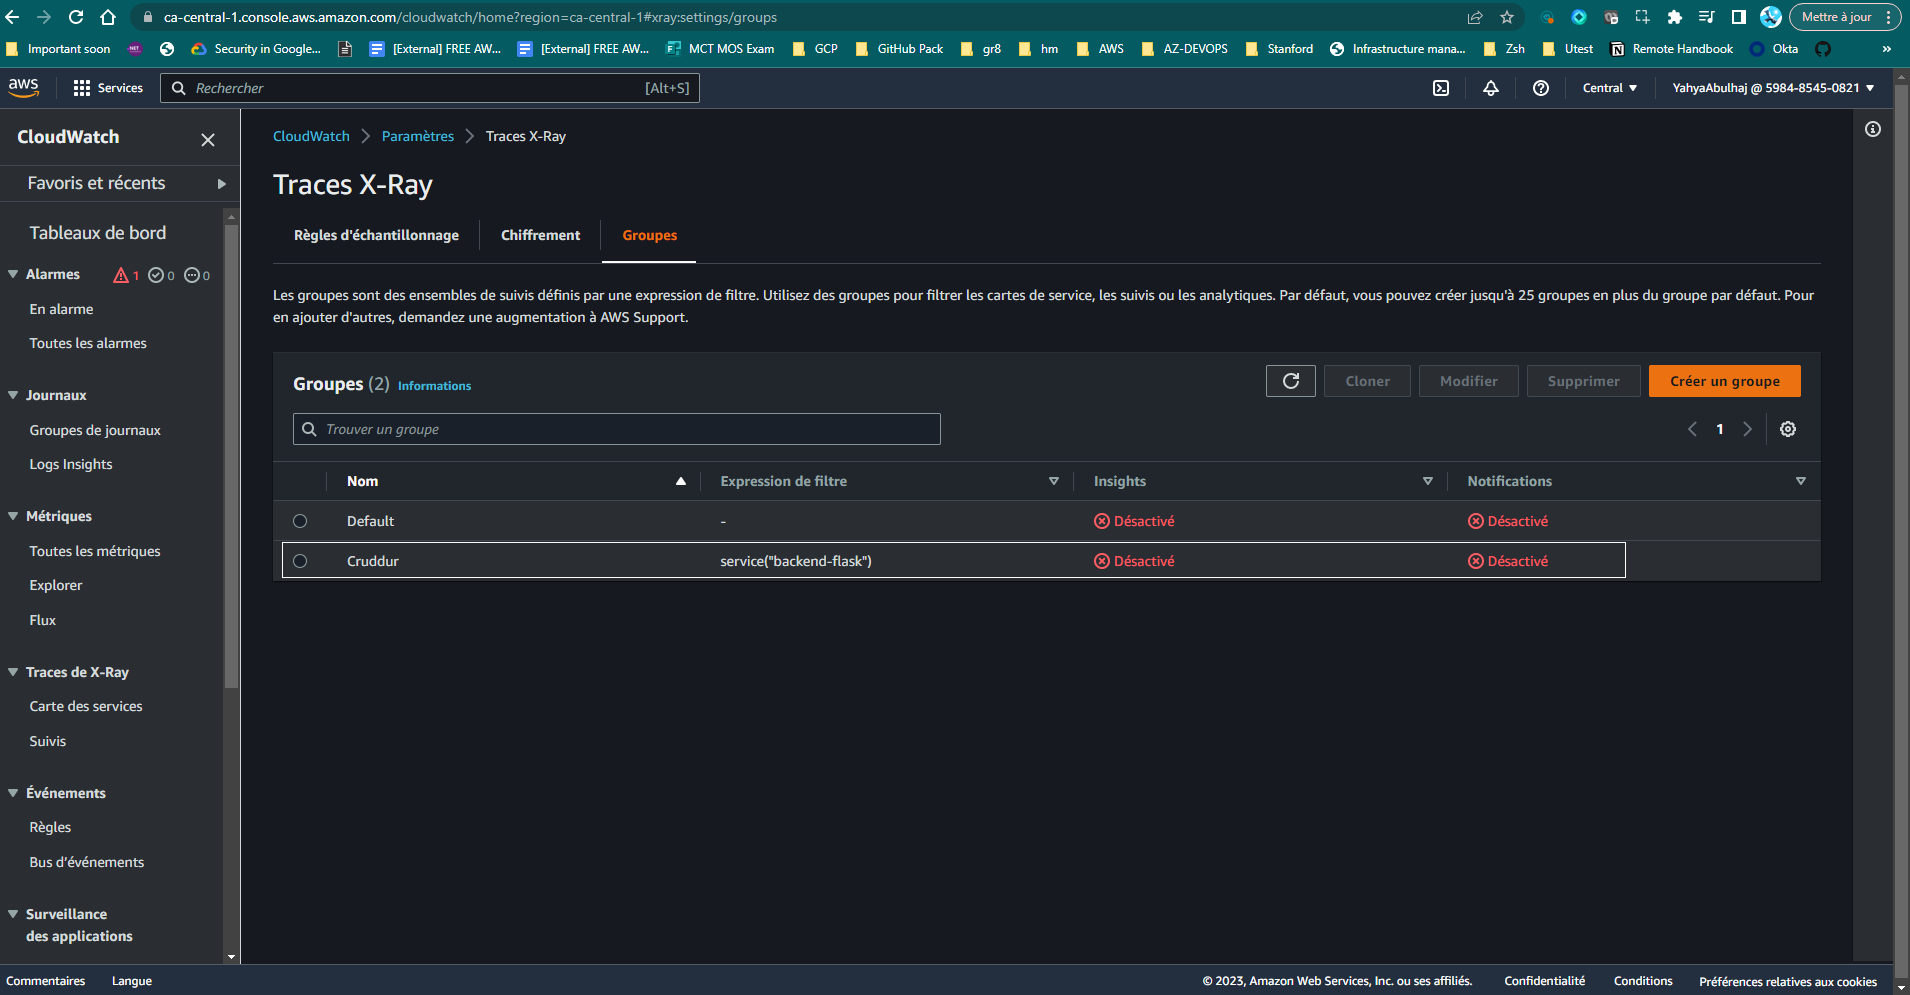
You should see the "Cruddur" group listed.
Sampling Rule in AWS X-RAY
When a request comes into the application, AWS X-Ray applies the defined Sampling Rules to determine whether that particular request should be traced or not. The level of information you wish to view is controlled by the sampling settings.
By strategically setting Sampling Rules, you can strike a balance between capturing enough data for meaningful insights and not overwhelming the X-Ray service with an excessive amount of trace data.
Let's proceed to define and configure our custom sampling rule.
- Create
xray.jsonfile inaws/json/and include the following rule
{
    "SamplingRule": {
        "RuleName": "Cruddur",
        "ResourceARN": "*",
        "Priority": 9000,
        "FixedRate": 0.1,
        "ReservoirSize": 5,
        "ServiceName": "backend-flask",
        "ServiceType": "*",
        "Host": "*",
        "HTTPMethod": "*",
        "URLPath": "*",
        "Version": 1
    }
  }
Let me now break down the configuration step by step for you.
"RuleName": "Cruddur": The name of the Sampling Rule is set to "Cruddur.""ResourceARN": "*": TheResourceARNfield specifies the Amazon Resource Name (ARN) of the AWS resource to which this rule applies. In this case, it is set to "*", which means the rule applies to all resources."Priority": 9000: The priority of this rule is set to 9000. Sampling Rules with higher priority take precedence over rules with lower priority when there are conflicting rules for the same request."FixedRate": 0.1: TheFixedRateindicates the sampling rate for this rule. Here, it is set to 0.1, which means approximately 10% of the requests that match this rule's conditions will be traced."ReservoirSize": 5: TheReservoirSizespecifies the number of traces that are allowed before the rule reaches its maximum capacity. In this case, the rule can collect up to 5 traces before it stops sampling new requests."ServiceName": "backend-flask": TheServiceNamefield is used to match against the service name of the incoming request. This rule applies to requests that have a service name equal to "backend-flask.""ServiceType": "*": TheServiceTypefield is used to match against the service type of the incoming request. The "*" value means this rule applies to requests of any service type."Host": "*": TheHostfield is used to match against the hostname of the incoming request. The "*" value means this rule applies to requests from any host."HTTPMethod": "*": TheHTTPMethodfield is used to match against the HTTP method of the incoming request. The "*" value means this rule applies to requests with any HTTP method."URLPath": "*": TheURLPathfield is used to match against the URL path of the incoming request. The "*" value means this rule applies to requests with any URL path."Version": 1: TheVersionfield specifies the version of the Sampling Rule schema. The value 1 represents the first version of the schema used for defining Sampling Rules.
- To generate the sampling, execute this command.
aws xray create-sampling-rule --cli-input-json file://aws/json/xray.json- Access the X-Ray page and navigate to the "Sampling" section to find more.
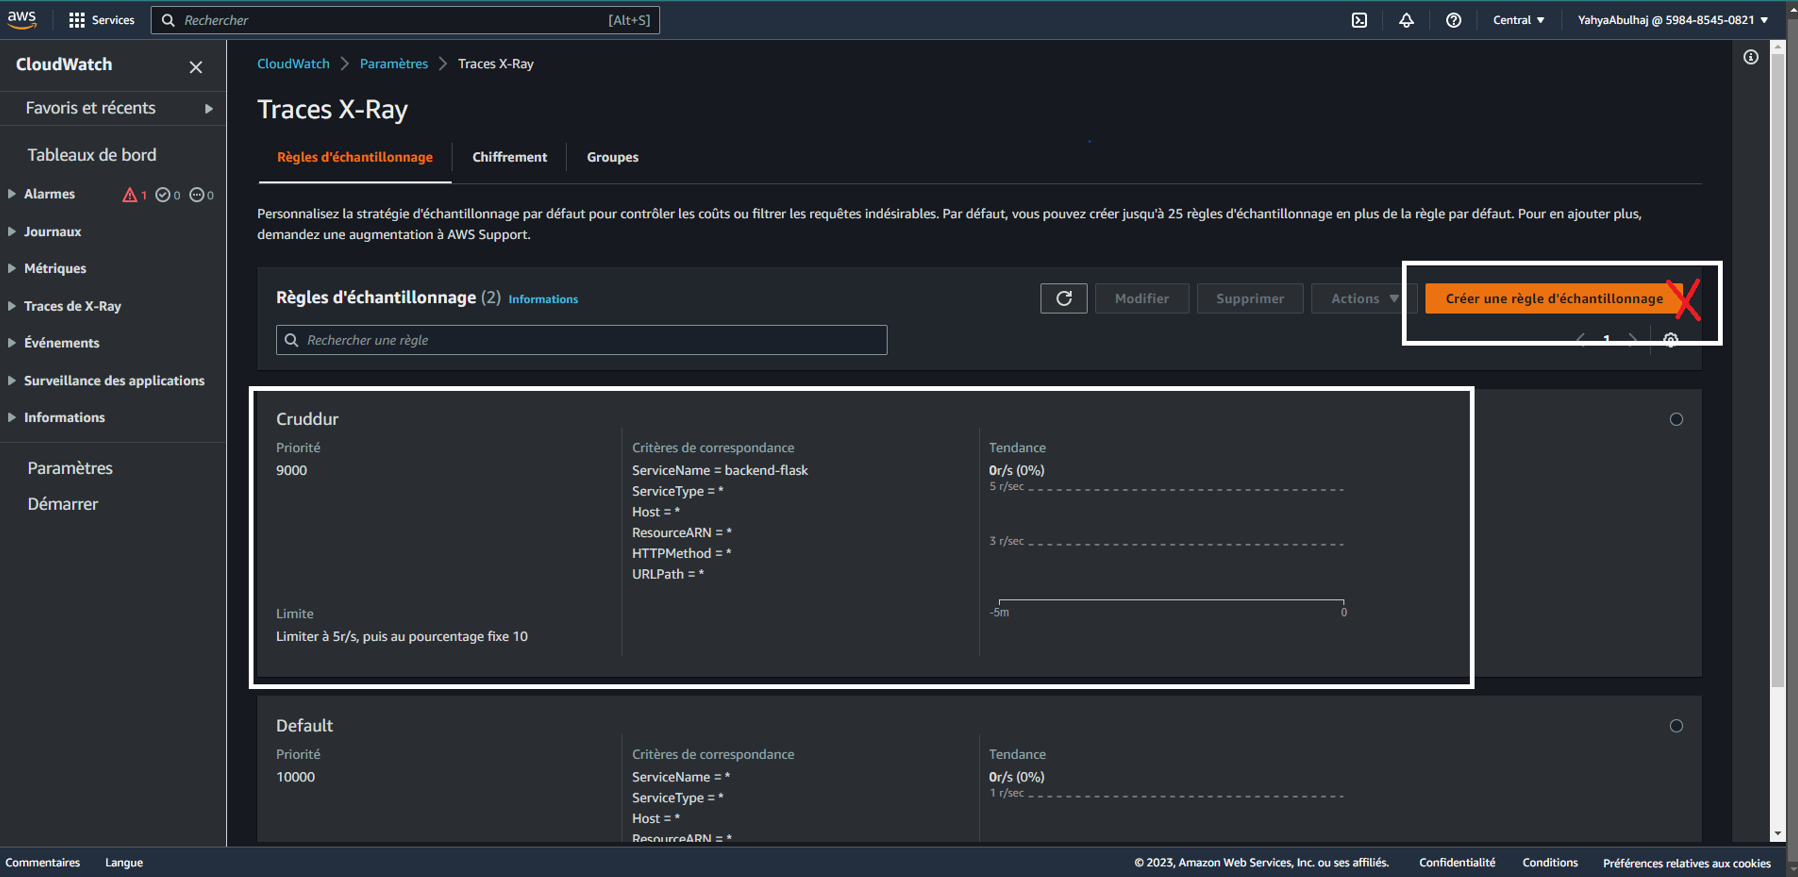
You have the option to configure the same settings through the console using a Cloudops approach.
X-Ray Subsegmentation
A subsegment is a nested segment that is created within an existing segment. Subsegments can be used to track the performance of a specific part of your application.
For example, you could create a subsegment for each database query that your application makes. This would allow you to track the performance of your database queries and identify any bottlenecks.
When you use the AWS X-Ray SDK for Python, you can use the begin_subsegment() method to create a subsegment within an existing segment. This can be useful for tracking the performance of a specific part of your application.
- Add the following import statements:
import aws_xray_sdk
from aws_xray_sdk.core import xray_recorder- Create a new X-Ray recorder and configure it with your AWS account ID and region.
xray_recorder = xray_recorder.create_default_recorder()
xray_recorder.configure(
    service_name="my-service",
    region="ca-central-1",
    sampling_rule_group_name="default",
)- Start a new segment for your application.
with xray_recorder.start_segment("my-segment"):
# Do some work here.- End the subsegment.
xray_recorder.end_subsegment()- End the main segment.
xray_recorder.end_segment()- Run cruddur and view view AWS X-Ray console.
Here is an example of how to create a subsegment in Python:
with xray_recorder.start_segment("my-segment"):
    with xray_recorder.begin_subsegment("my-subsegment"):
        # Do some work here.
This will create a subsegment called my-subsegment within the main segment my-segment. The subsegment will be automatically ended when the with block is exited.
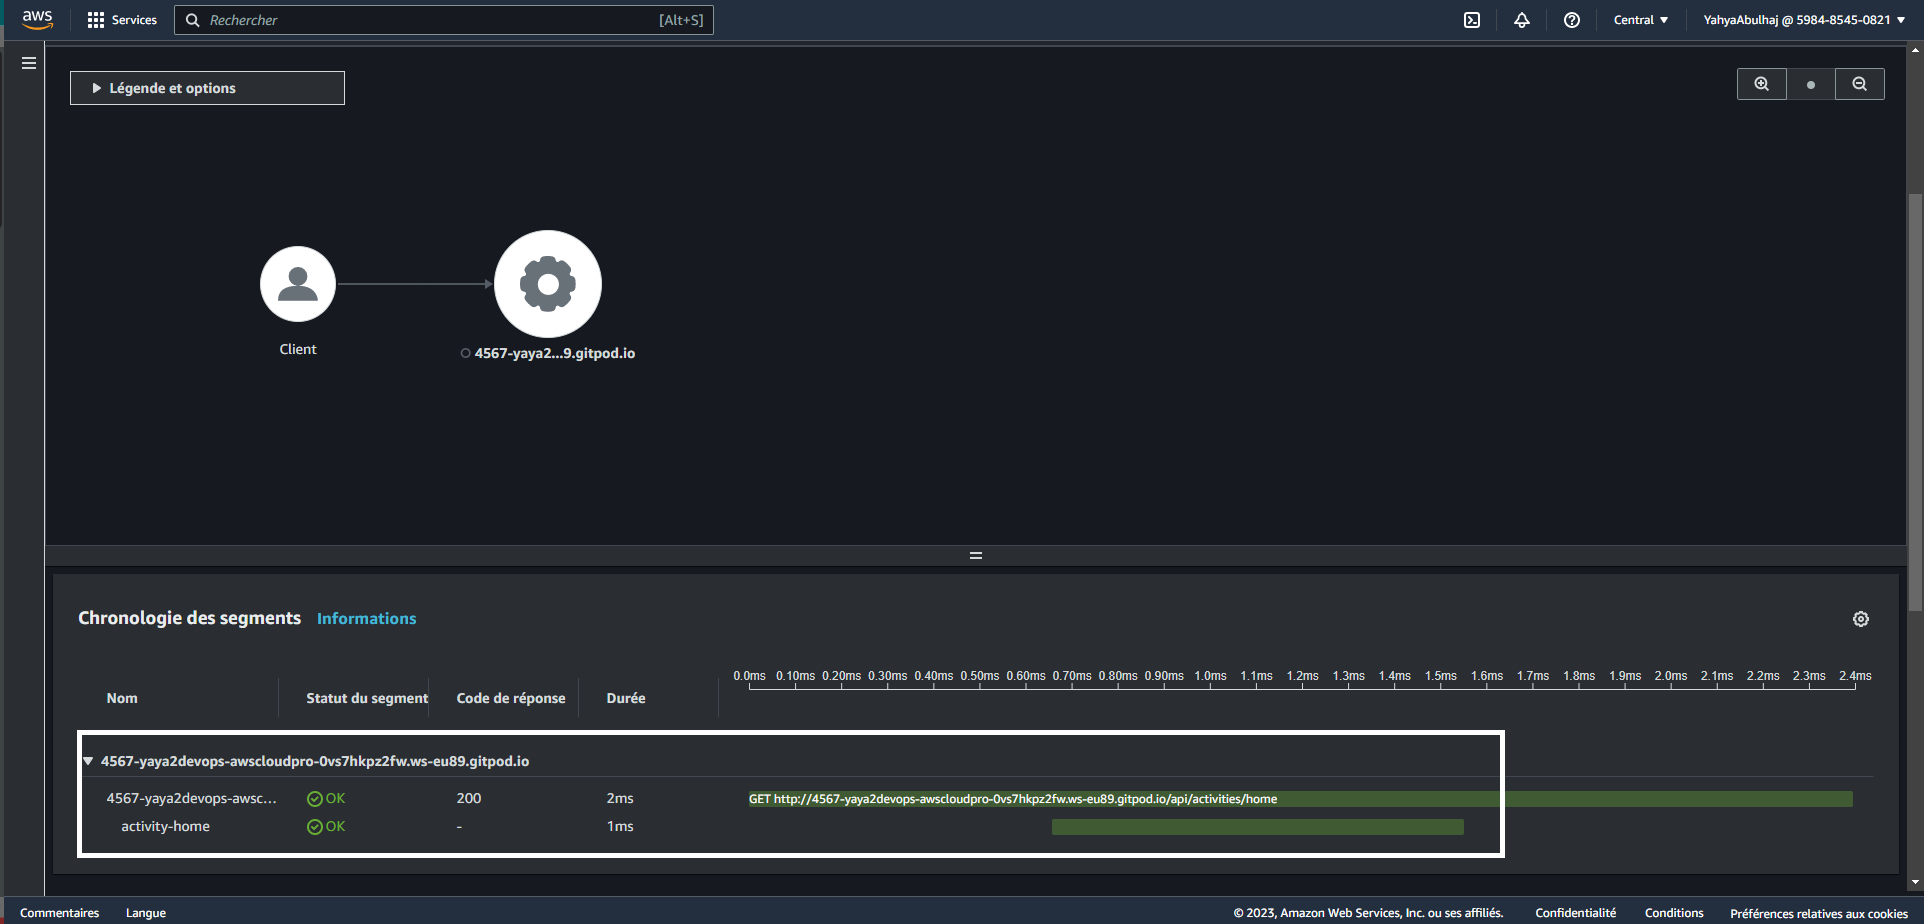
Update the segment with the actual endpoint you wish to test, and modify the subsegment with the specific subcomponent you intend to observe closely e.g activity-home.
Monitor FlaskApp with CloudWatch
Amazon CloudWatch is a monitoring service to collect and track metrics, collect and monitor log files, set alarms, and automatically react to changes in your cloud resources.
Prerequisites
Python 3 • Flask • Docker • Watchtower
Watchtower allows you to easily send log messages from your app to Cloudwatch.
To install Watchtower from pip, use the following command:
pip install watchtowerAlternatively, make sure to include it in the requirements.txt along other backend dependencies.
watchtowerInstructions
This code will configure your application to log to AWS CloudWatch.
- Import the necessary modules:
import watchtower
import logging
from time import strftime- Configure the logger to use CloudWatch.
Insert the following code directly beneath app = Flask(__name__) within the app.py file.
LOGGER = logging.getLogger(__name__)
LOGGER.setLevel(logging.DEBUG)
console_handler = logging.StreamHandler()
cw_handler = watchtower.CloudWatchLogHandler(log_group='cruddur')
LOGGER.addHandler(console_handler)
LOGGER.addHandler(cw_handler)
LOGGER.info('Test log')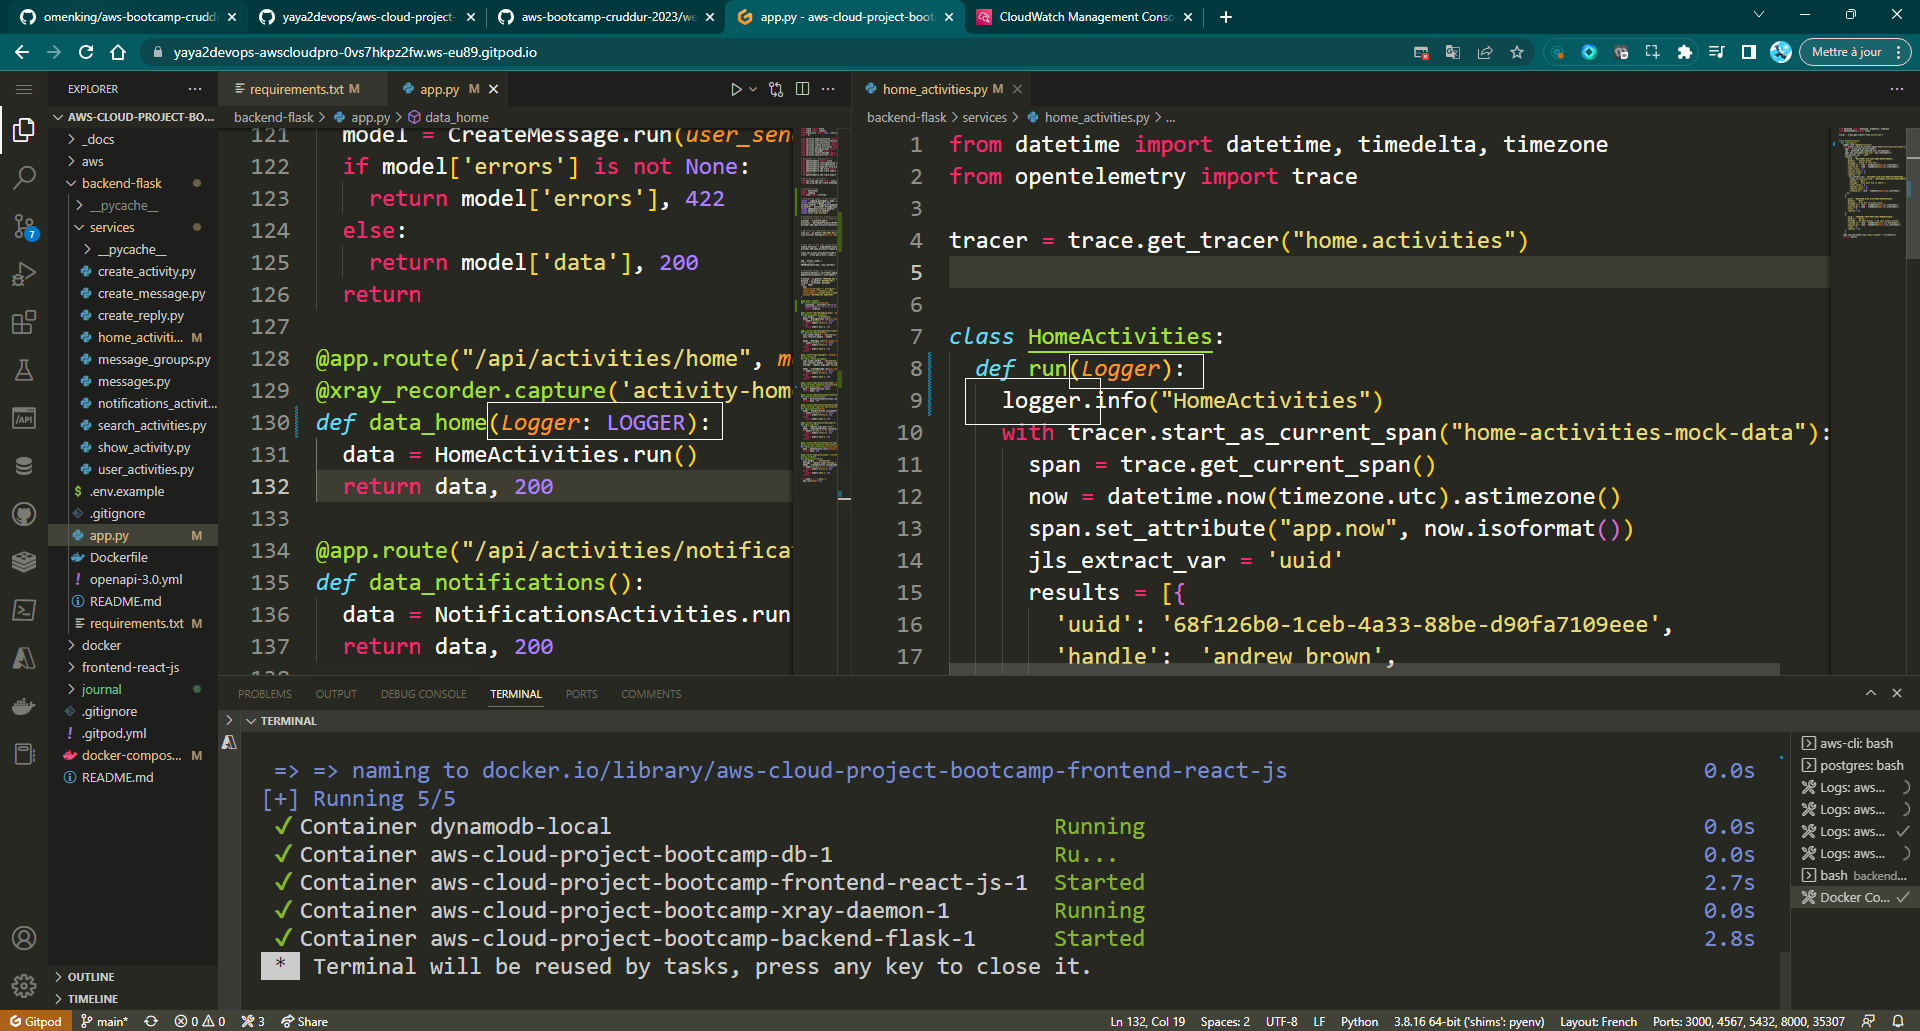
- Add a custom logger in
/backend-flask/app.pyon top of current routes.
@app.after_request
def after_request(response):
    timestamp = strftime('[%Y-%b-%d %H:%M]')
    LOGGER.error('%s %s %s %s %s %s', timestamp, request.remote_addr, request.method, request.scheme, request.full_path, response.status)
return response- Update the
/api/activities/homeroute to pass the logger as an argument.
@app.route("/api/activities/home", methods=["GET"])
def data_home(logger):
    data = HomeActivities.run(logger)
return data, 200- Record the information log
HomeActivitiesin thebackend-flask/services/home_activities.pyfile.
Add the logger as an argument to therun() function in home_activities.py.
Def run(logger):
LOGGER.info('Hello Cloudwatch! from /api/activities/home')- Add the AWS environment variables to
docker-compose.yml.
AWS_DEFAULT_REGION: "${AWS_DEFAULT_REGION}"
AWS_ACCESS_KEY_ID: "${AWS_ACCESS_KEY_ID}"
AWS_SECRET_ACCESS_KEY: "${AWS_SECRET_ACCESS_KEY}"
Refer to my previous documentation on the matter. We call it Progress.
- Launch the app and hit the backend endpoint of
/api/activities/home.
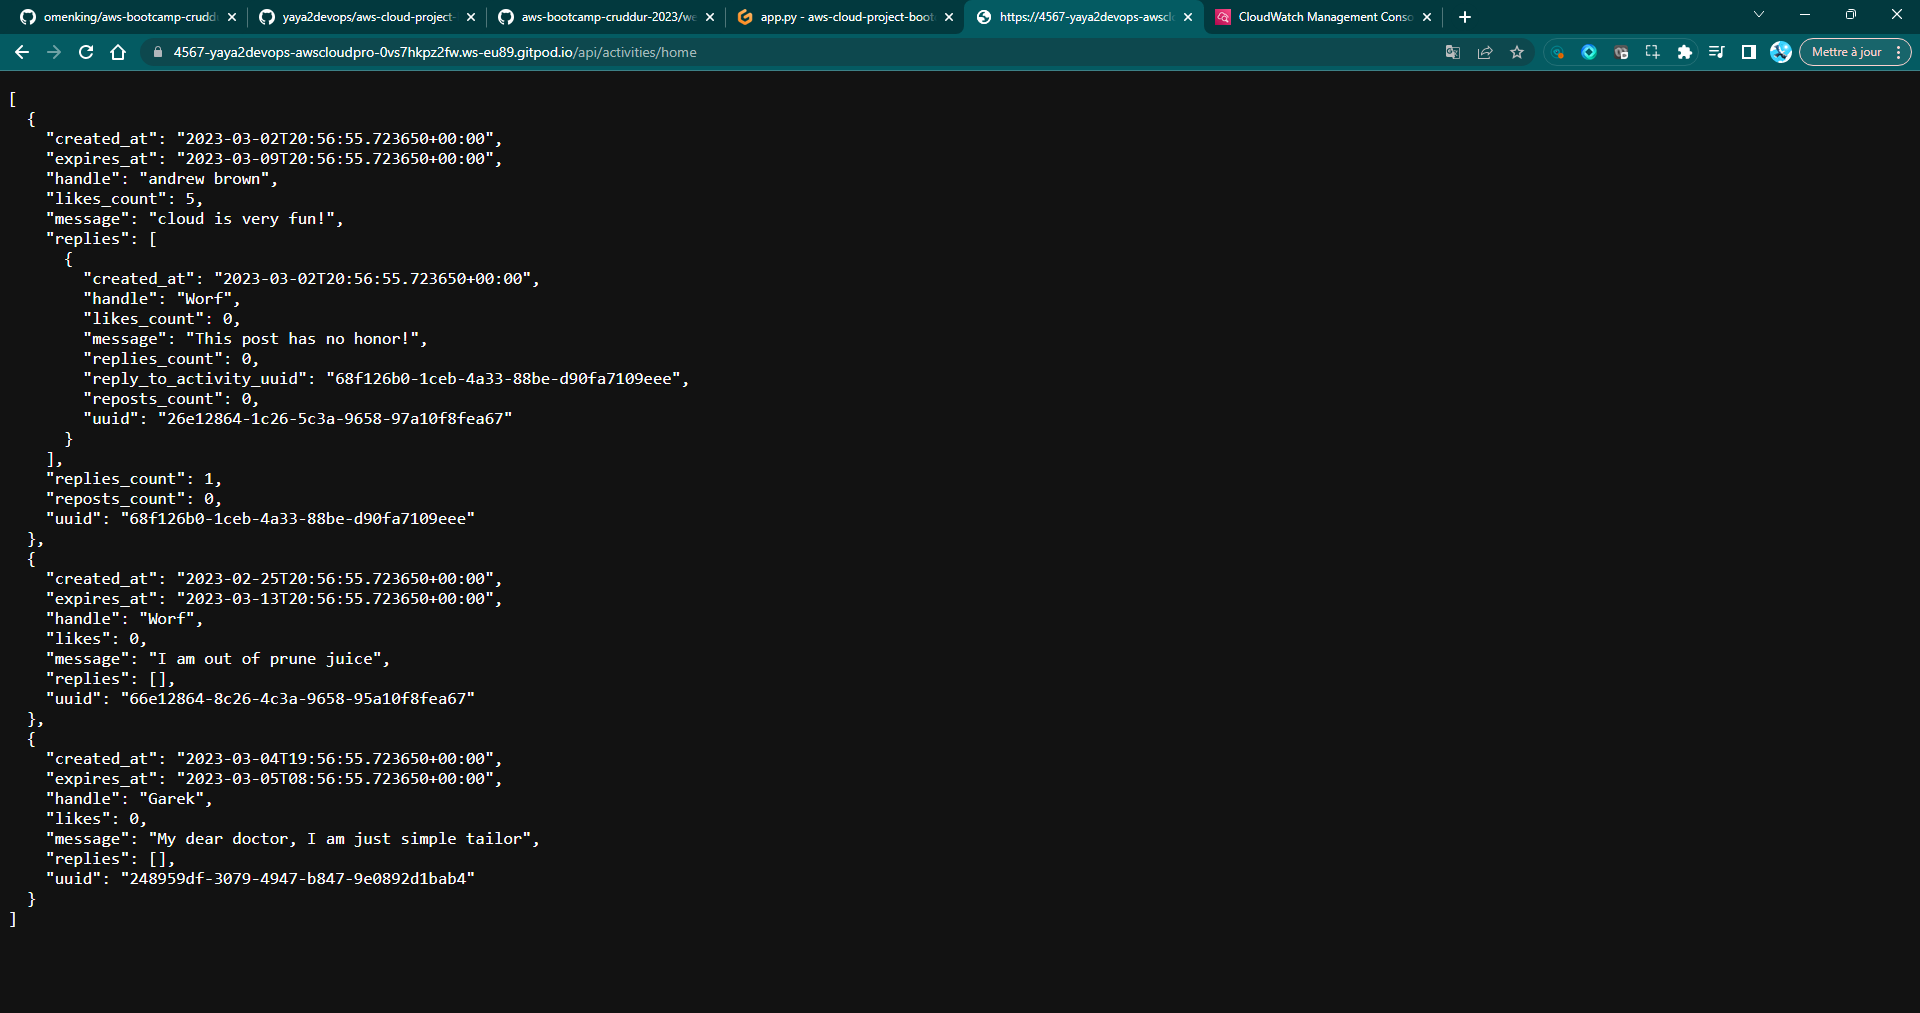
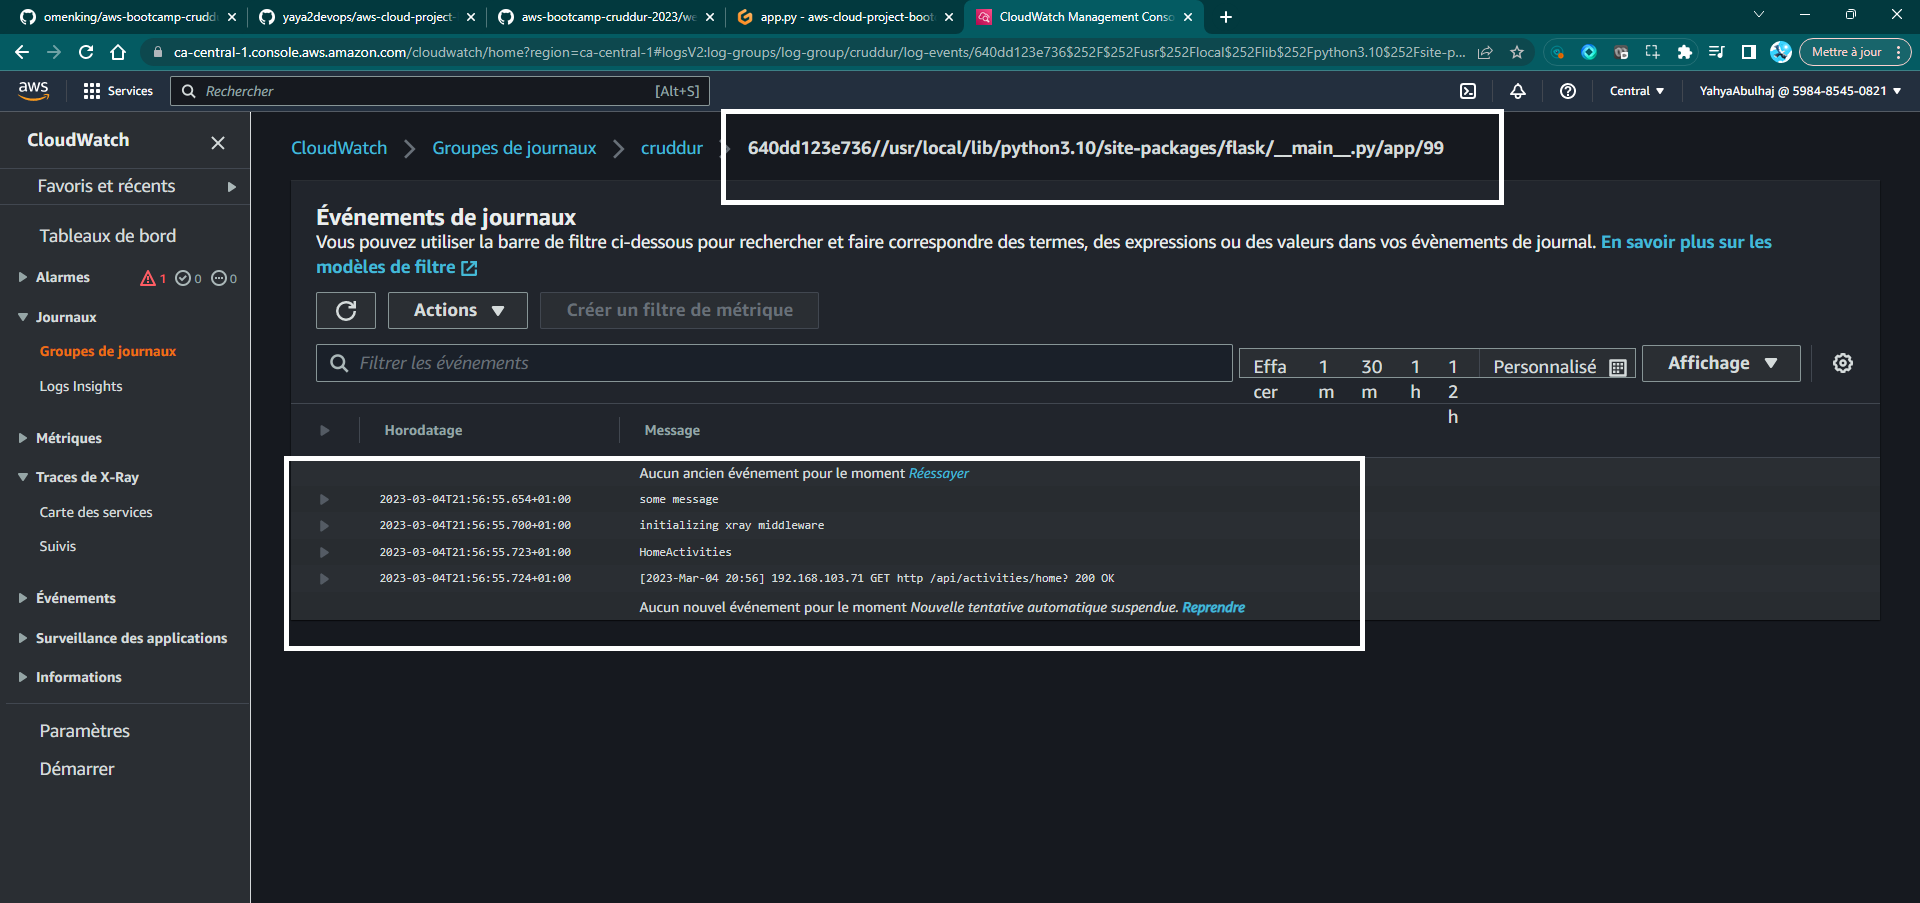
docker compose up- View the log stream data in AWS CloudWatch Log group of cruddur.
- Launch CloudWatch
- Navigate to Log Groups
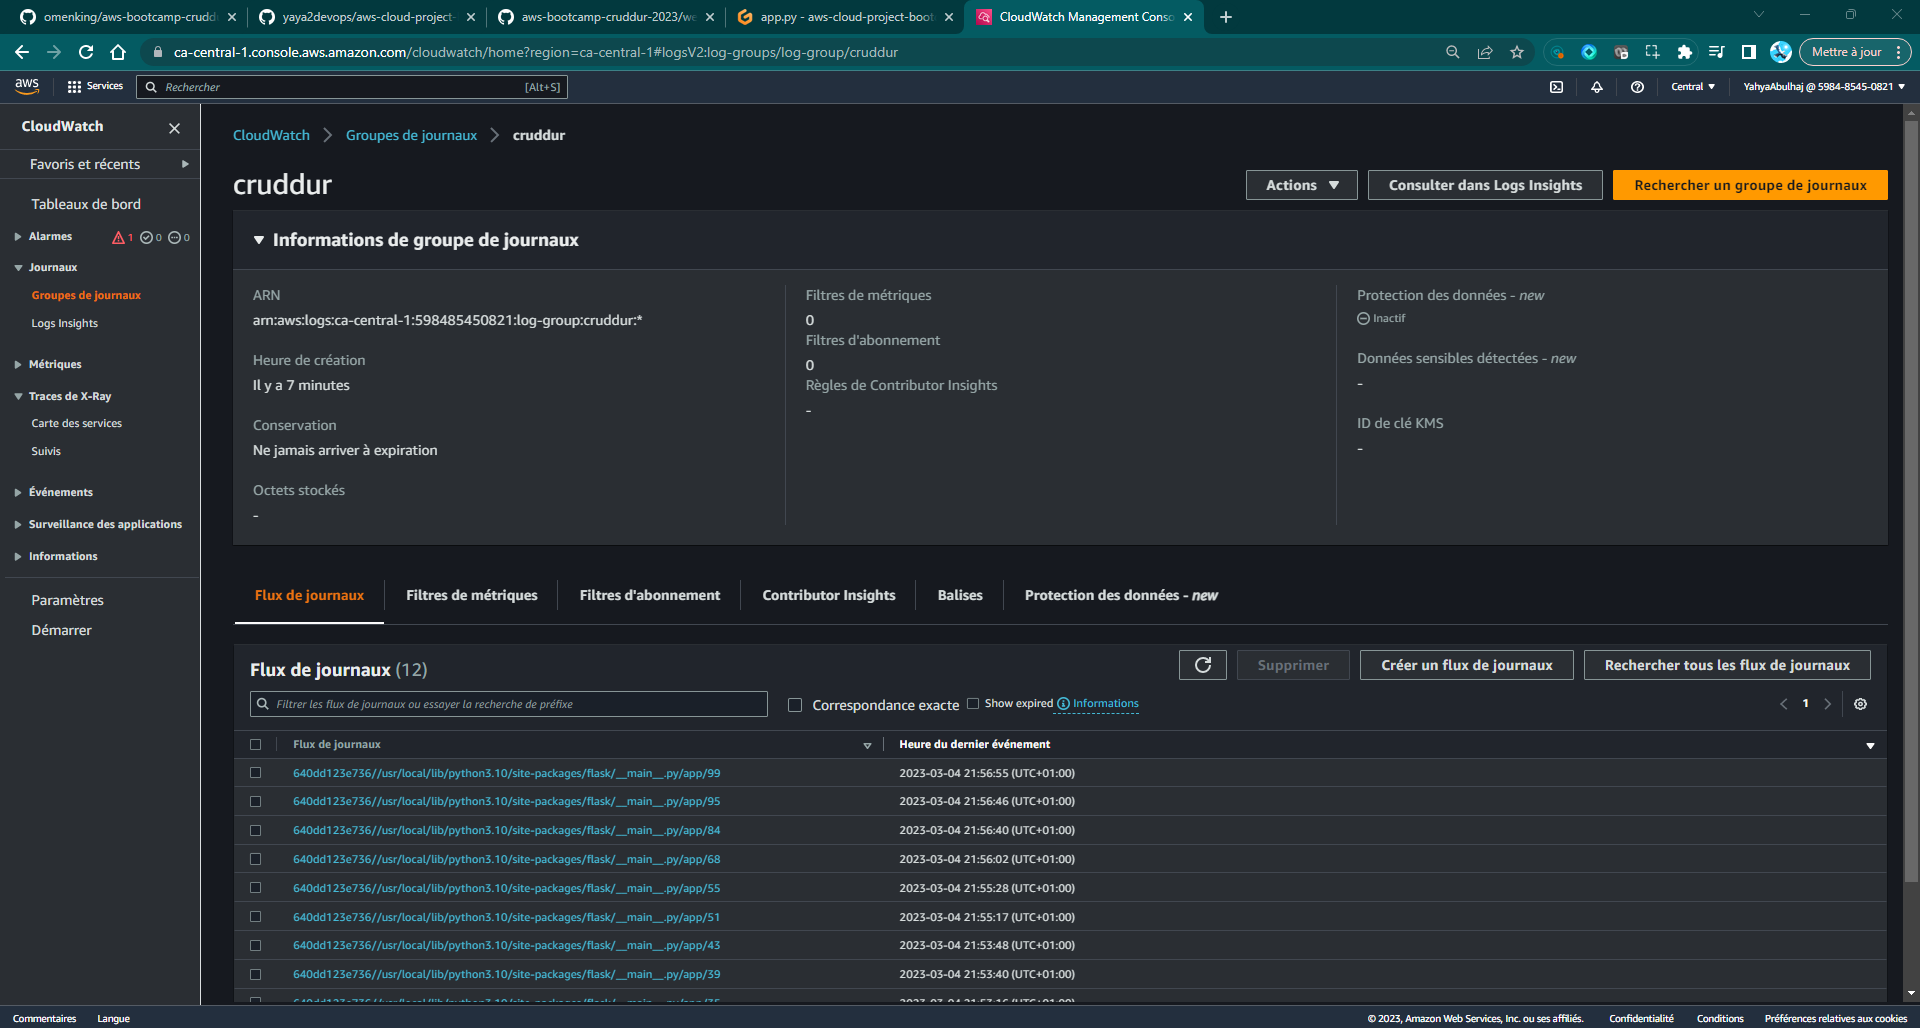
Ensure that the backend properly displays JSON data on the home route.
Tips
- Make sure that you have installed the necessary dependencies before following the instructions.
- You can use the
docker-compose up -dcommand to launch the app in the background. - You can use the
docker-compose logscommand to view the logs of the app.
Experiment with modifying your app to observe if CloudWatch Logs are effectively capturing any relevant events or logs e.g.
Spending : Feel free to comment out the code sections related to the CloudWatch Logger to help reduce
Security Best Practices
Observability data can be a valuable target for attackers. It can be used to identify vulnerabilities, track user activity, and launch attacks. Therefore, it is important to take steps to secure observability data.
When implementing code, it is important to consider the security implications.
- Use secure tracing libraries. There are a number of tracing libraries available that offer security features, such as authentication, authorization, and encryption.
- Encrypt observability data. This will help to protect the privacy of data and make it more difficult for attackers to access.
- Use a secure tracing backend. The tracing backend should be protected from unauthorized access.
Make sure that your team is aware of the security risks associated with observability and distributed tracing, and that they know how to mitigate those.
- Use a centralized tracing solution. This will make it easier to collect and analyze tracing data from all of your microservices.
- Enable sampling. Sampling can help you reduce the amount of tracing data that you collect, without sacrificing too much visibility.
- Encrypt tracing data. This will help to protect the privacy of your users.
- Use a tracing tool that supports security features. Some tracing tools offer features such as authentication, authorization, and encryption.
Additional Resources
Here are the projects that are working on improving the security of observability and distributed tracing:
- The OpenTelemetry project: https://opentelemetry.io/ (opens in a new tab)
- The Jaeger project: https://jaegertracing.io/ (opens in a new tab)
- The Zipkin project: https://zipkin.io/ (opens in a new tab)
- The Traceable AI project: https://www.traceable.ai/ (opens in a new tab)
Security Measures
- Use a secure tracing protocol, such as TLS or mTLS.
- Encrypt tracing data at rest and in transit.
- Use a central observability platform that has strong security features.
- Implement security best practices for your applications, such as input validation and output sanitization.
Related Security Direction
| Project | Description | URL |
|---|---|---|
| OpenTelemetry Security Working Group | A set of security best practices for observability. | https://opentelemetry.io/security/ (opens in a new tab) |
| Jaeger Security Project | A security extension for the Jaeger tracing tool. | https://github.com/jaegertracing/jaeger-security (opens in a new tab) |
| Zipkin Security Project | A security extension for the Zipkin tracing tool. | https://github.com/openzipkin/zipkin-security (opens in a new tab) |
| Traceable AI Security Project | A security solution for distributed tracing. | https://www.traceable.ai/security/ (opens in a new tab) |
Conclusion
You should always look to improve the security of your observability and distributed tracing systems. Aim to protect your applications from security threats and to troubleshoot problems more effectively.
Error-Free Code with Rollbar
Rollbar provides a central dashboard where you can see all of your errors, including their stack traces, environment information, and user feedback.
![]()
Rollbar also integrates with many popular development tools, so you can easily send errors from your IDE or continuous integration server.
Before we begin, make sure you have the following prerequisites.
- A Rollbar account
- The
rollbarandblinkerPython packages
Instructions
- Log in to Rollbar and create a new project.
- Copy the Rollbar access token from the project settings page.
- Add the following packages to your project's
requirements.txtfile:
blinker
rollbar- Install the packages by running the following command:
pip install -r requirements.txt- Configure the Rollbar access token in your project's environment.
export ROLLBAR_ACCESS_TOKEN="<rollbar-access-token>"
gp env ROLLBAR_ACCESS_TOKEN="<rollbar-access-token>"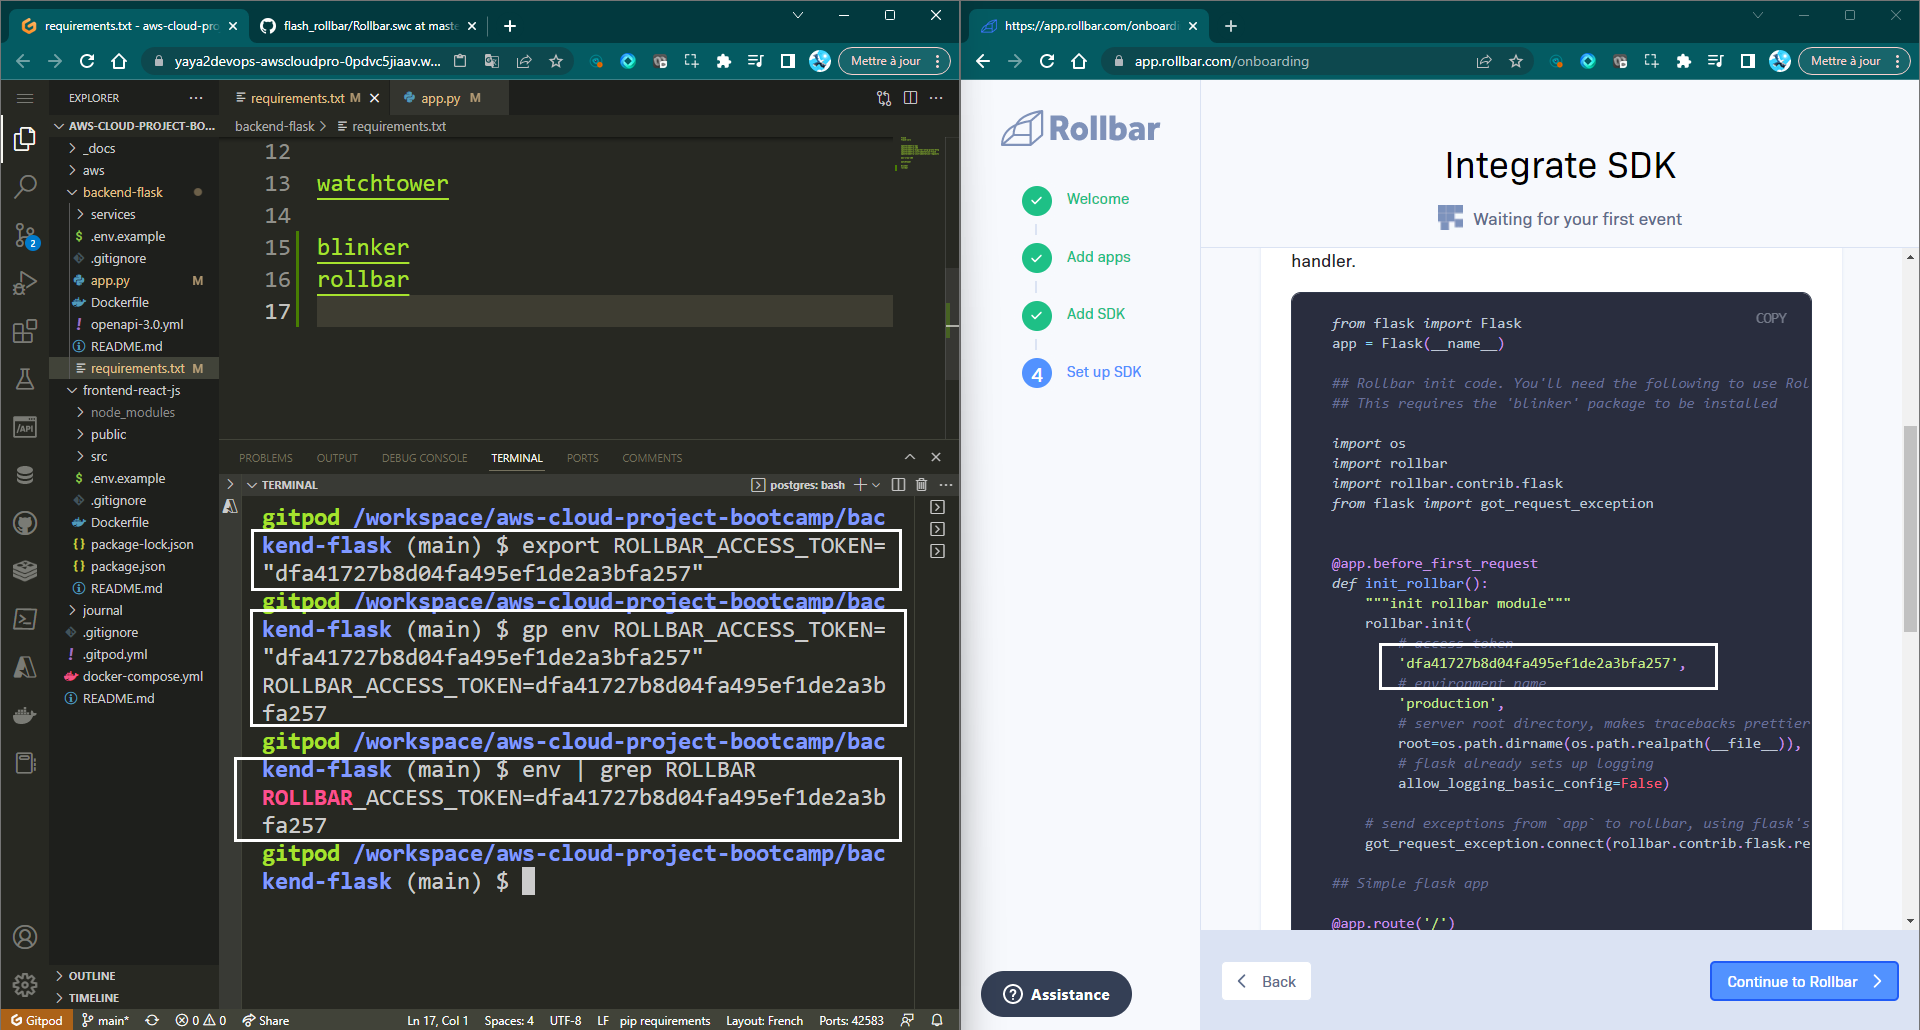
Replace rollbar-access-token with the actual access token obtained from Rollbar.
e.g. we are using Docker, you can also add the following environment variable to your docker-compose.yml file:
ROLLBAR_ACCESS_TOKEN=YOUR_ACCESS_TOKEN- Import the
rollbarandrollbar.contrib.flaskmodules in your application's main file.
import rollbar
import rollbar.contrib.flask- Initialize the Rollbar client in your application's
before_first_requesthook under theapp = Flask(__name__).
#--here
Rollbar_access_token = os.getenv('ROLLBAR_ACCESS_TOKEN')
#--here
@app.before_first_request
def init_rollbar():
"""init rollbar module"""
rollbar.init(
rollbar_access_token,
'production',
root=os.path.dirname(os.path.realpath(__file__)),
allow_logging_basic_config=False)
# signal exceptions from `app` to rollbar.
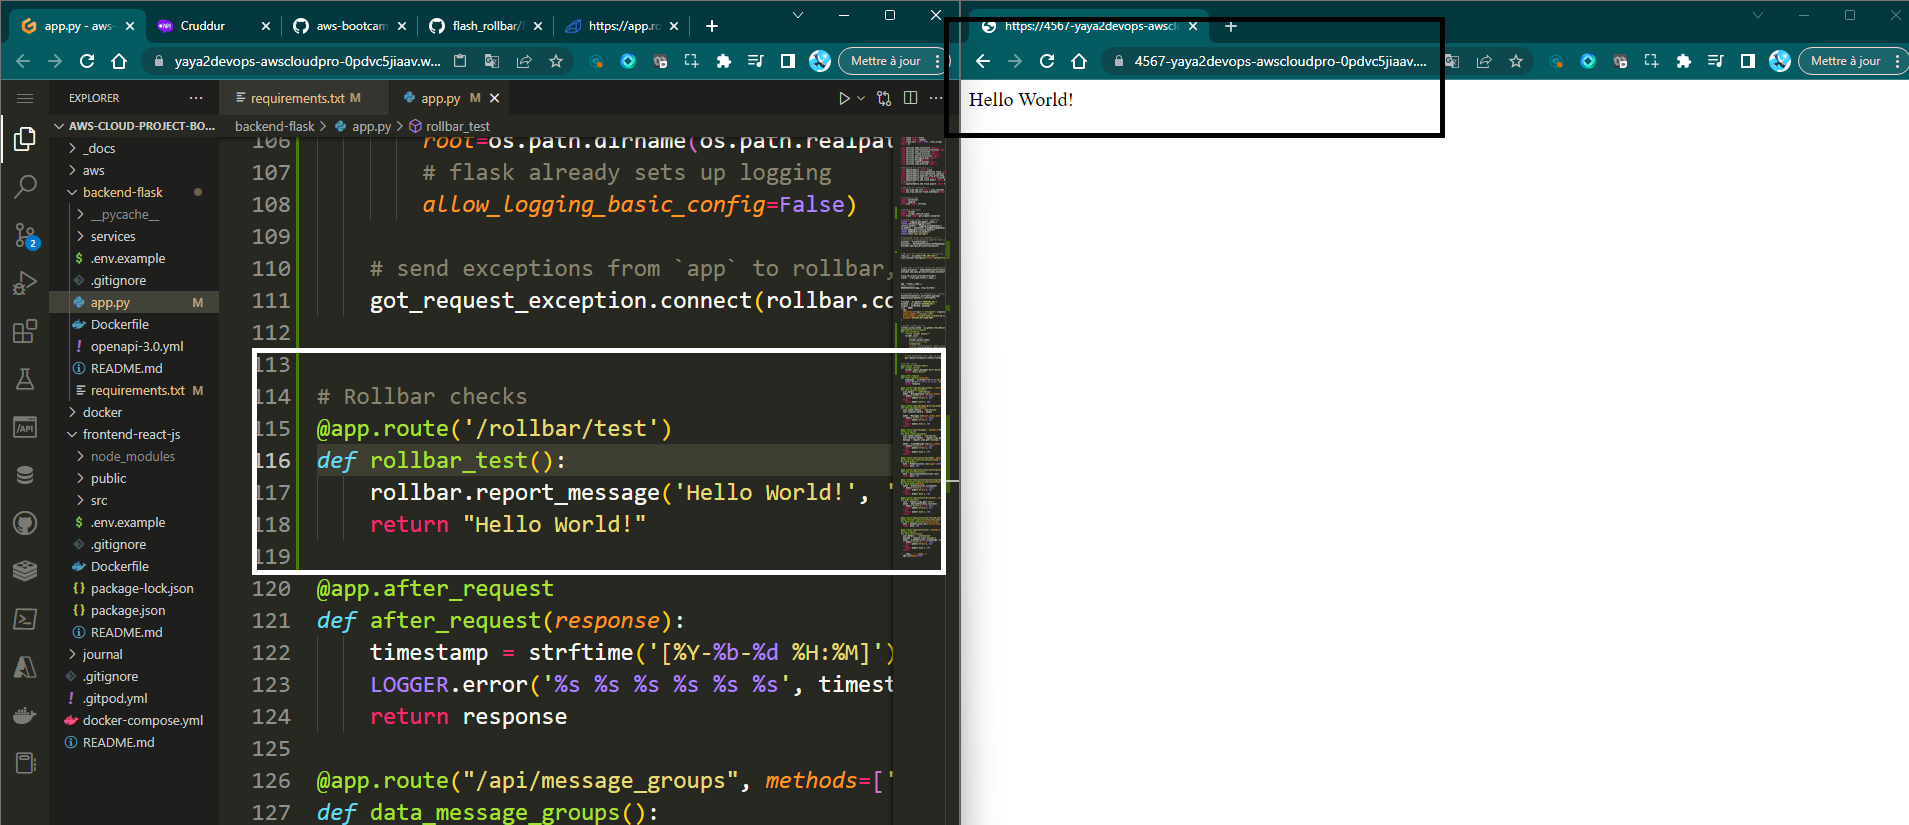
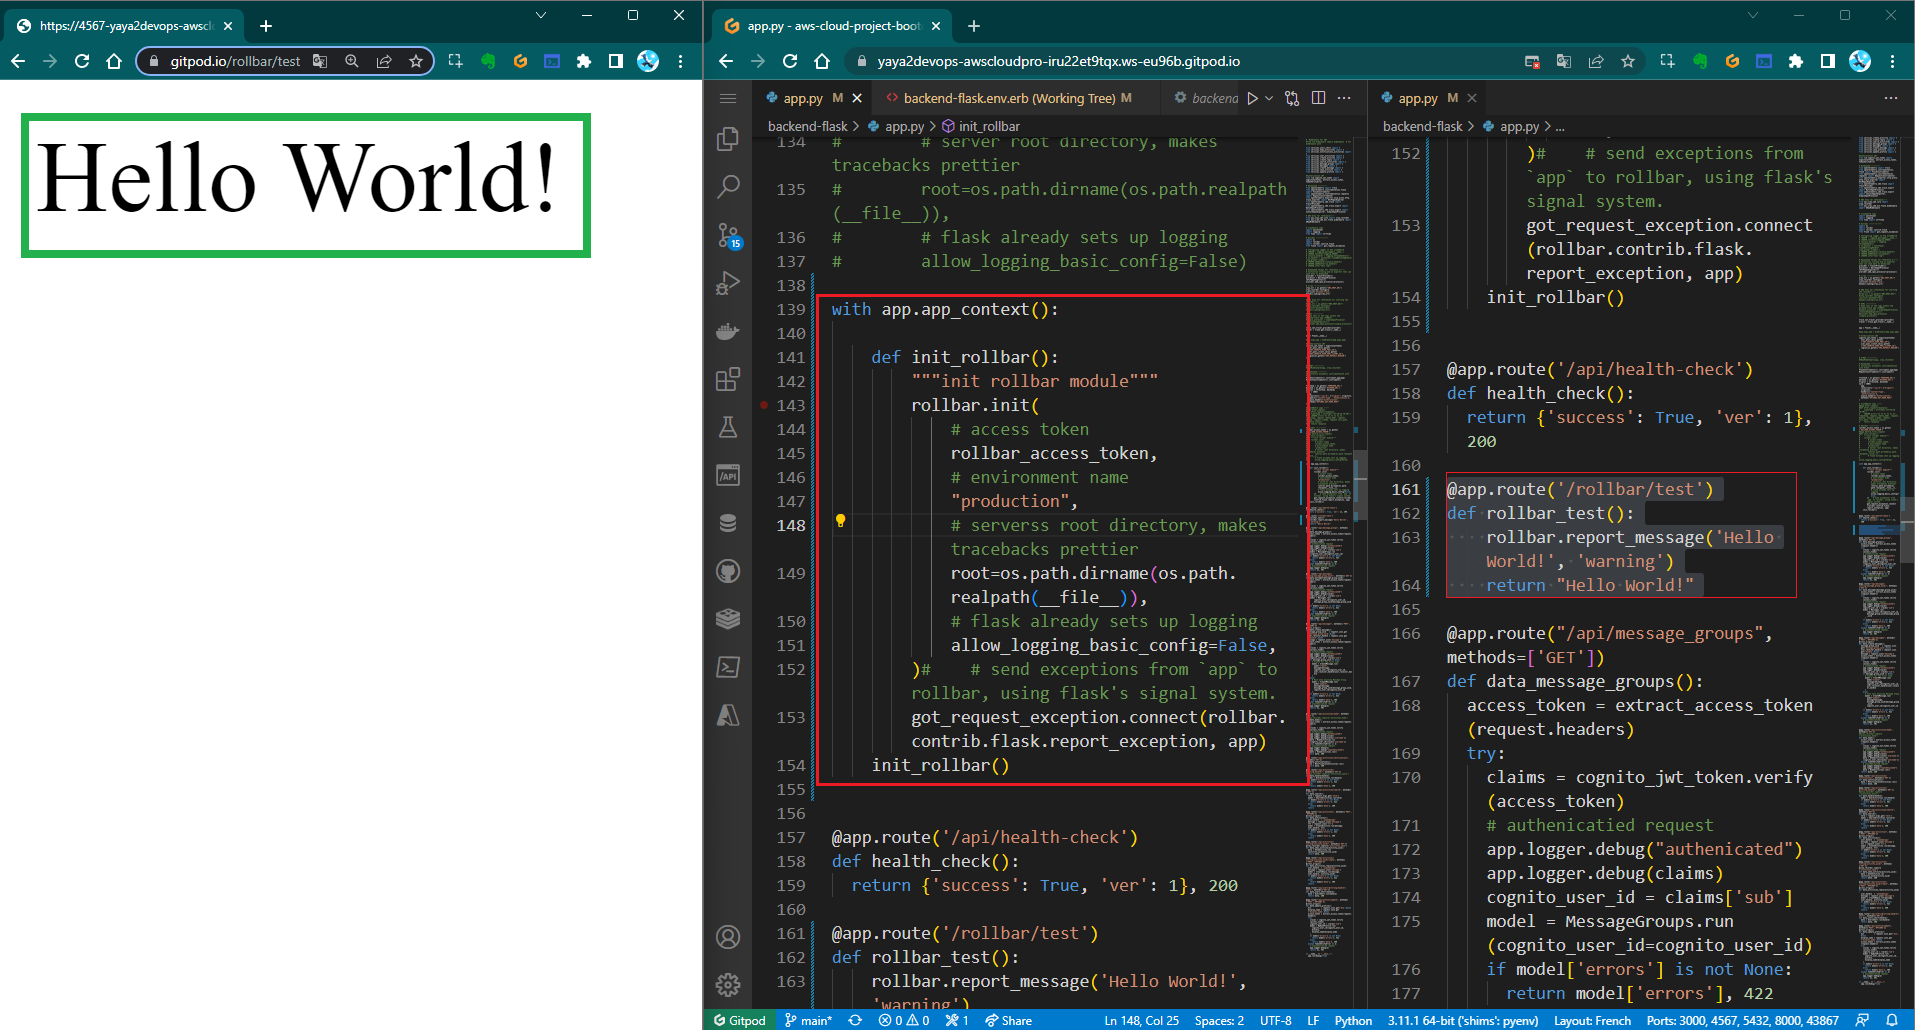
got_request_exception.connect(rollbar.contrib.flask.report_exception, app)- Create a new endpoint in your Flask application that will trigger Rollbar to log a test message.
@app.route('/rollbar/test')
def rollbar_test():
    rollbar.report_message('Hello World!', 'warning')
return "Hello World!"- Launch your application and navigate to the
/rollbar/testendpoint using the browser or API client.
Upon a seamless and highly successful onboarding experience, you will be greeted with the magical "Hello World!"
Picture this!
We will have to conduct a comprehensive check within the Rollbar product itself to ensure its presence.
- Expand the verification process of the Hello World message by checking the Rollbar Interface.
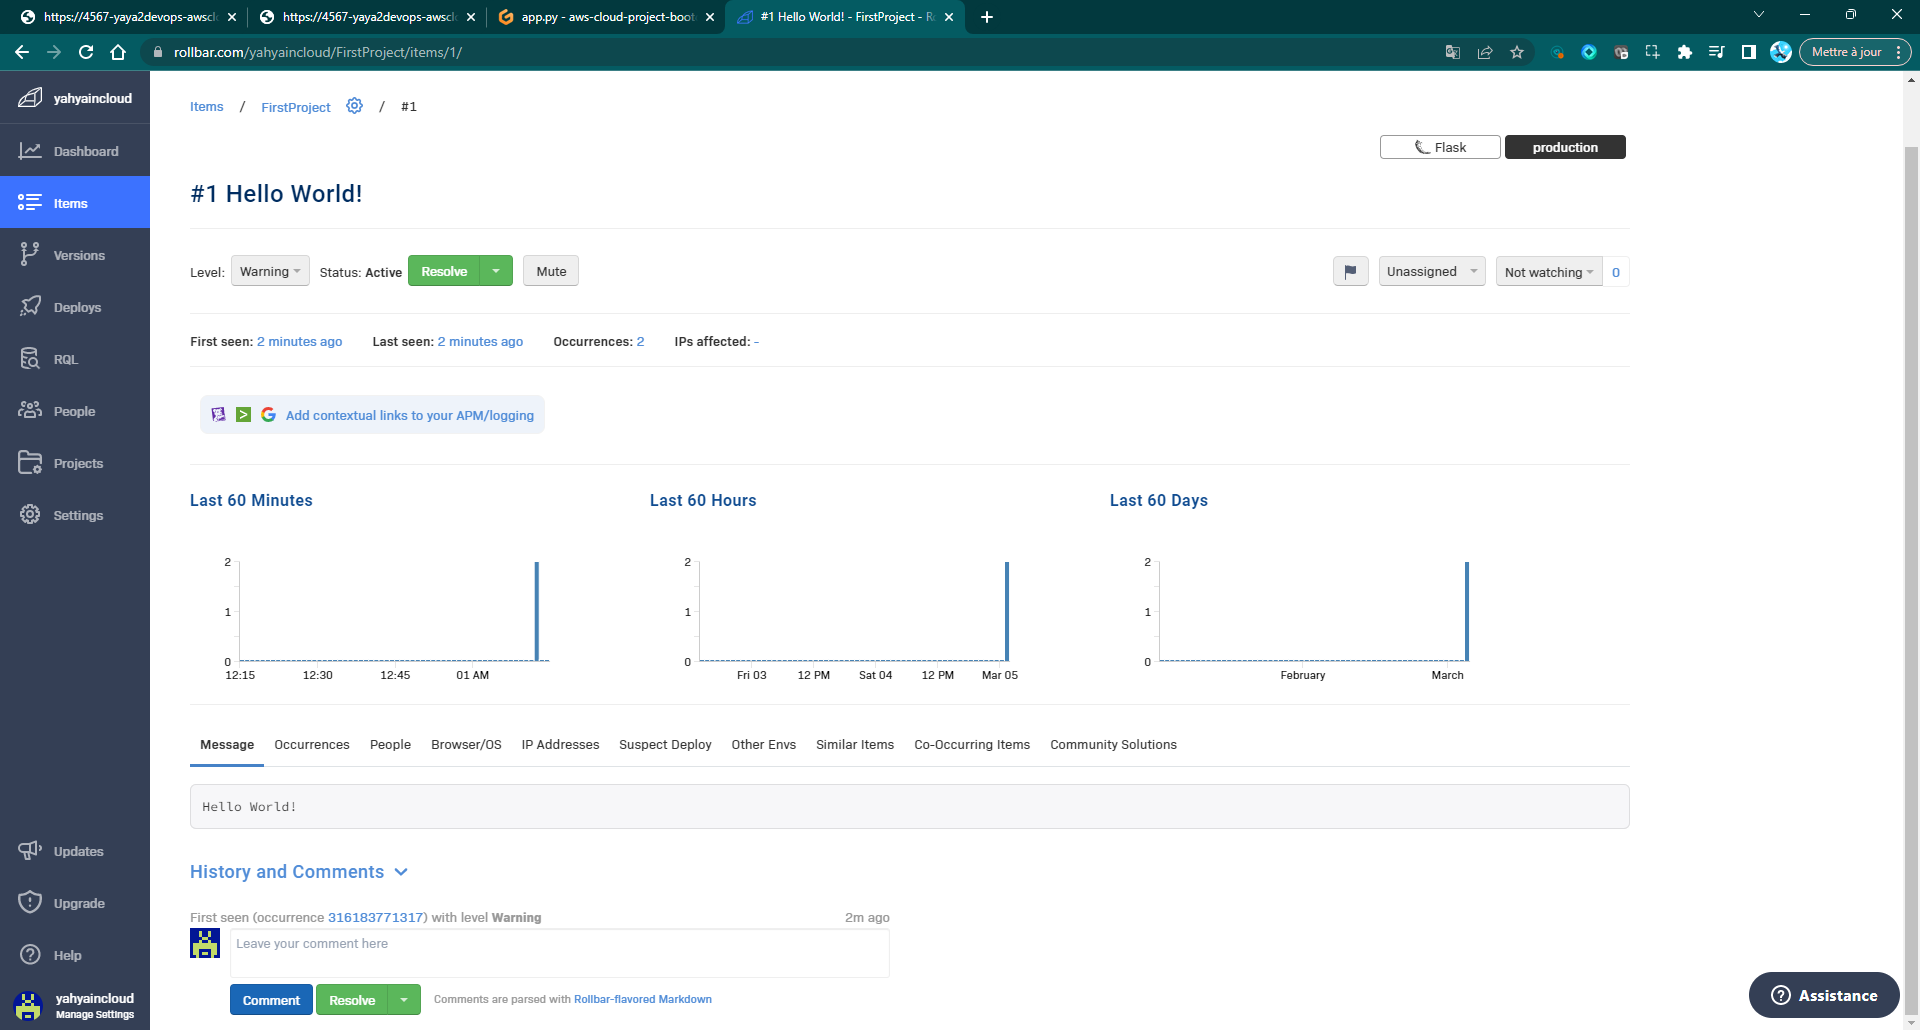
This step will be carried out as part of the onboarding process, and once it is successfully completed, we can consider the onboarding process finished.
Expanded Instrumentation in Rollbar
By default, Rollbar only collects a limited amount of data about each error. This can make it difficult to troubleshoot errors and identify trends.
Additional instrumentation can help you collect more data about your errors.
This data can be used to the following reasons.
- Troubleshoot errors: collecting more data about each error, you can get a better understanding of what caused the error.
- Identify trends: By collecting data about all of the errors in your application, you can identify trends.
- Improve the quality of your code: You can learn from your mistakes and improve the quality of your code and prevent future errors.
Here are some of the additional instrumentation options that you can use.
- Custom context: You can add custom context to your error reports by using the
rollbar.contextfunction. - Custom breadcrumbs: a way to track the flow of execution .You can add custom breadcrumbs to your error reports by using the
rollbar.add_breadcrumb()function.
Instrument further like a Pro with these use cases.
Rollbar instrumentation got updated on the process.
@app.before_first_request has been removed from flask.
Intentional Errors for Rollbar
In order to demonstrate the robustness and effectiveness of the onboarding, we generated two errors that trigger exceptions and are caught by the Rollbar error monitoring system.
Error 1: Missing Argument in Logger in HomeActivities.run
In this first example, we purposefully omitted a crucial argument in the logger while executing the HomeActivities.run function.
The omission of the 'LOGGER' argument resulted in an unhandled exception, which our product effectively detected and sent to Rollbar for further analysis.
By triggering this error, we demonstrated that our product provides real-time error reporting and a seamless integration with Rollbar to facilitate a quick response to such issues.
Error 2: Undefined "AWS Auth" - Deliberate Scenario
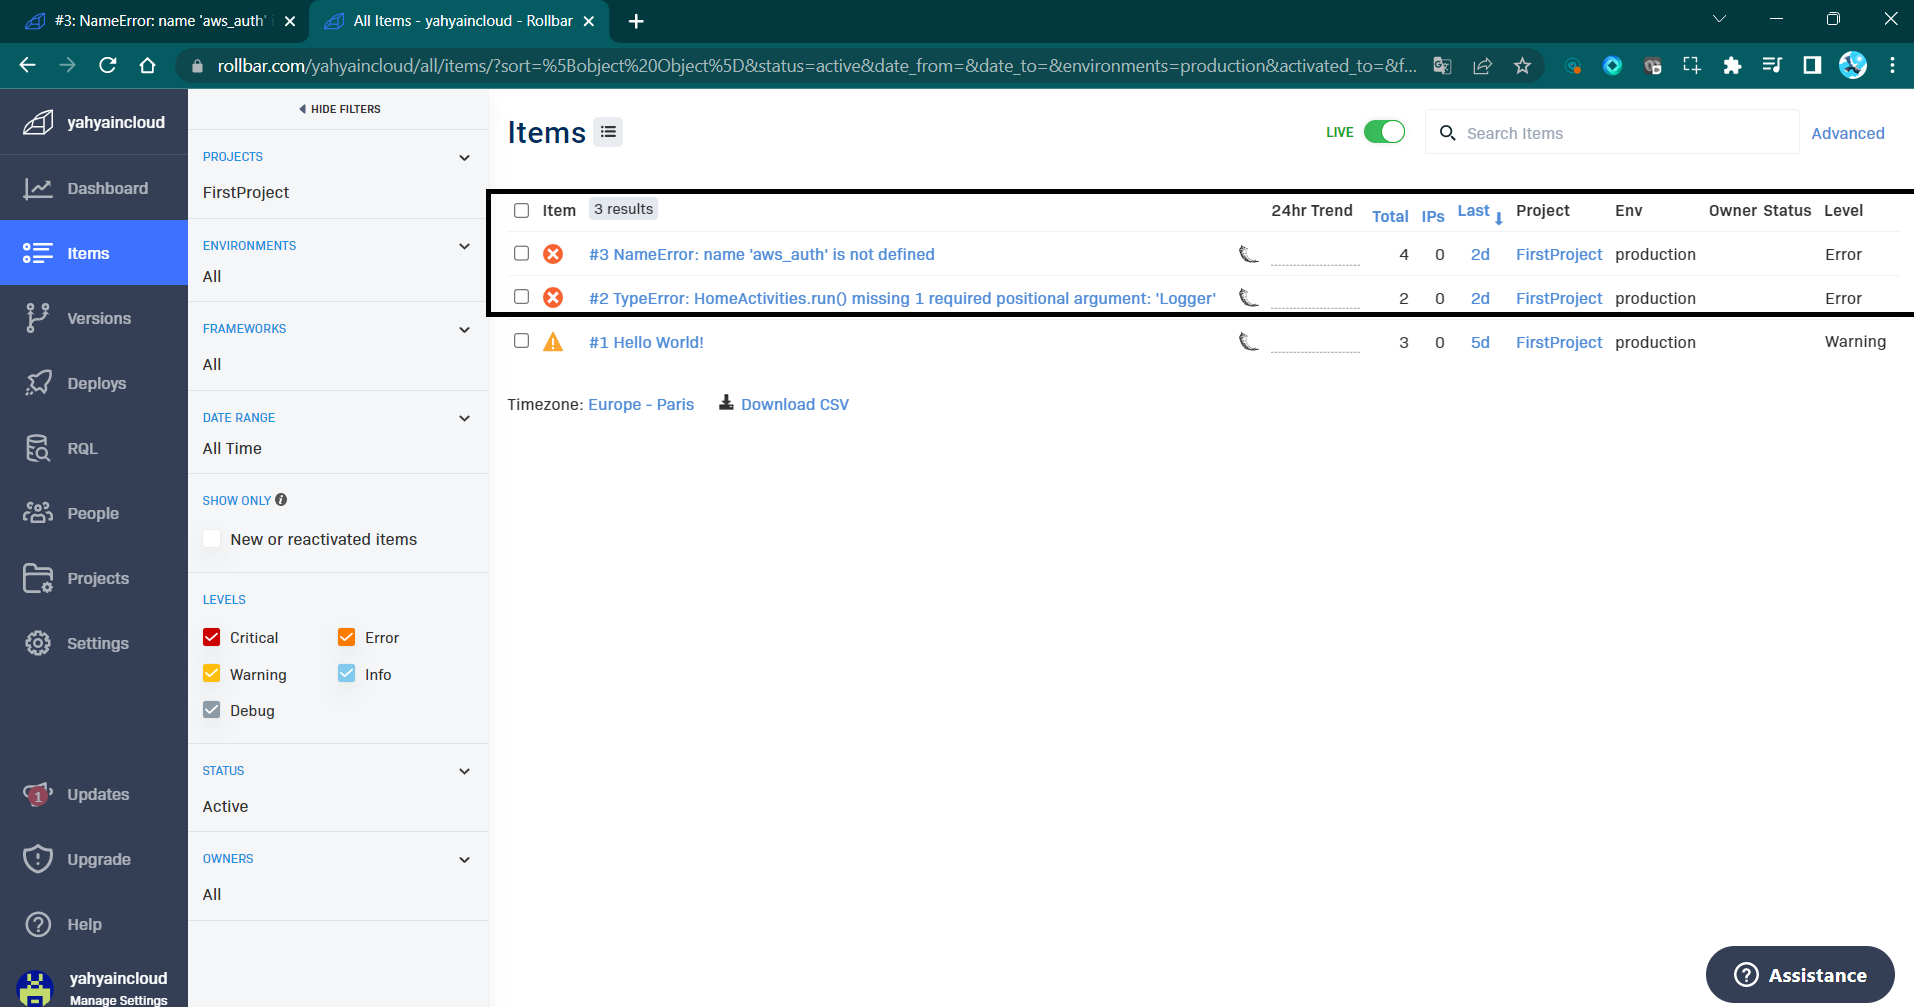
Error 2: The second intentional error involved referencing an undefined variable.
This deliberate mistake is designed to simulate a scenario where developers might inadvertently overlook variable definitions or experience issues with external service integrations.
Our product effectively caught this error and dispatched it to Rollbar, enabling developers to track and investigate the root cause effortlessly.
- You can also try to set an error that will cause an exception to be raised which will be sent to Rollbar.
Five of many Rollbar Errors Can Be Found in this area.
If you are looking for a way to improve the quality of your code (not just Python), I encourage you to try Rollbar. It is a powerful tool that can help you to track and fix errors quickly and easily.
Stay in Touch with Rollbar
- Rollbar Documentation: https://rollbar.com/docs/ (opens in a new tab)
- Rollbar Blog: https://rollbar.com/blog/ (opens in a new tab)
- Rollbar on Twitter: https://twitter.com/rollbar (opens in a new tab)
Python Preferred Installer Program
Python package management has long been a source of frustration for developers. The original package manager, pip, is relatively simple to use, but it lacks some important features, such as the ability to create virtual environments and manage dependencies. This from experience can lead to problems when working on collaborative projects or when trying to install multiple versions of the same package.
I had a python project with fellow developer. We wanted to use the same version of the requests package, but he had a different version installed on his dev env. When I tried to install the requests package using pip, it installed the latest version, which is not be compatible with his ver.
This caused problems with our project so we went on a mission to find alternatives.
Pipenv and Poetry are two package managers that address some of the shortcomings of pip.
- Pipenv is a "batteries included" package manager that provides a unified interface for creating and managing virtual environments, installing packages, and resolving dependencies.
- Poetry is a more lightweight package manager that focuses on simplicity and ease of use.
Both Pipenv and Poetry can help to improve the package management experience in Python. They provide a number of features that are not available in pip, such as:
- The ability to create and manage virtual environments: Virtual environments allow you to install packages in a isolated environment, which can help to prevent conflicts between different projects.
- The ability to specify dependencies in a structured format: This makes it easier to track dependencies and to ensure that your project is using the correct versions of the packages that it needs.
- The ability to resolve dependencies automatically: This can save you a lot of time, as you don't have to manually track down and install all of the dependencies that your project needs.
- The ability to publish packages to the Python Package Index (PyPI): This allows you to share your packages with other developers.
In addition to these features, Pipenv and Poetry also offer a number of other benefits, such as:
- They are both actively maintained and supported.
- They have large and active communities of users and developers.
- They are both well-documented.
I recommend giving Pipenv or Poetry a try. They can help to make your life easier and your projects more reliable.
Table comparing the features of pip, Pipenv, and Poetry:
| Feature | pip | Pipenv | Poetry |
|---|---|---|---|
| Virtual environments | Yes | Yes | Yes |
| Dependency management | Basic | Advanced | Advanced |
| Dependency resolution | Manual | Automatic | Automatic |
| Publishing to PyPI | Yes | Yes | Yes |
| Documentation | Good | Excellent | Excellent |
| Community | Large | Large | Large |
As you can see, Pipenv and Poetry offer a number of features that are not available in pip. These features can help to improve the package management experience in Python, making it easier to track dependencies, resolve conflicts, and publish packages.
Here are some additional resources that you may find helpful
Pipenvdocumentation: https://pipenv.pypa.io/en/latest/ (opens in a new tab)Poetrydocumentation: https://python-poetry.org/docs/ (opens in a new tab)- The Python Packaging User Guide: https://packaging.python.org/en/latest/ (opens in a new tab)